Gold (XAU/USD) – Bull or Bear ?

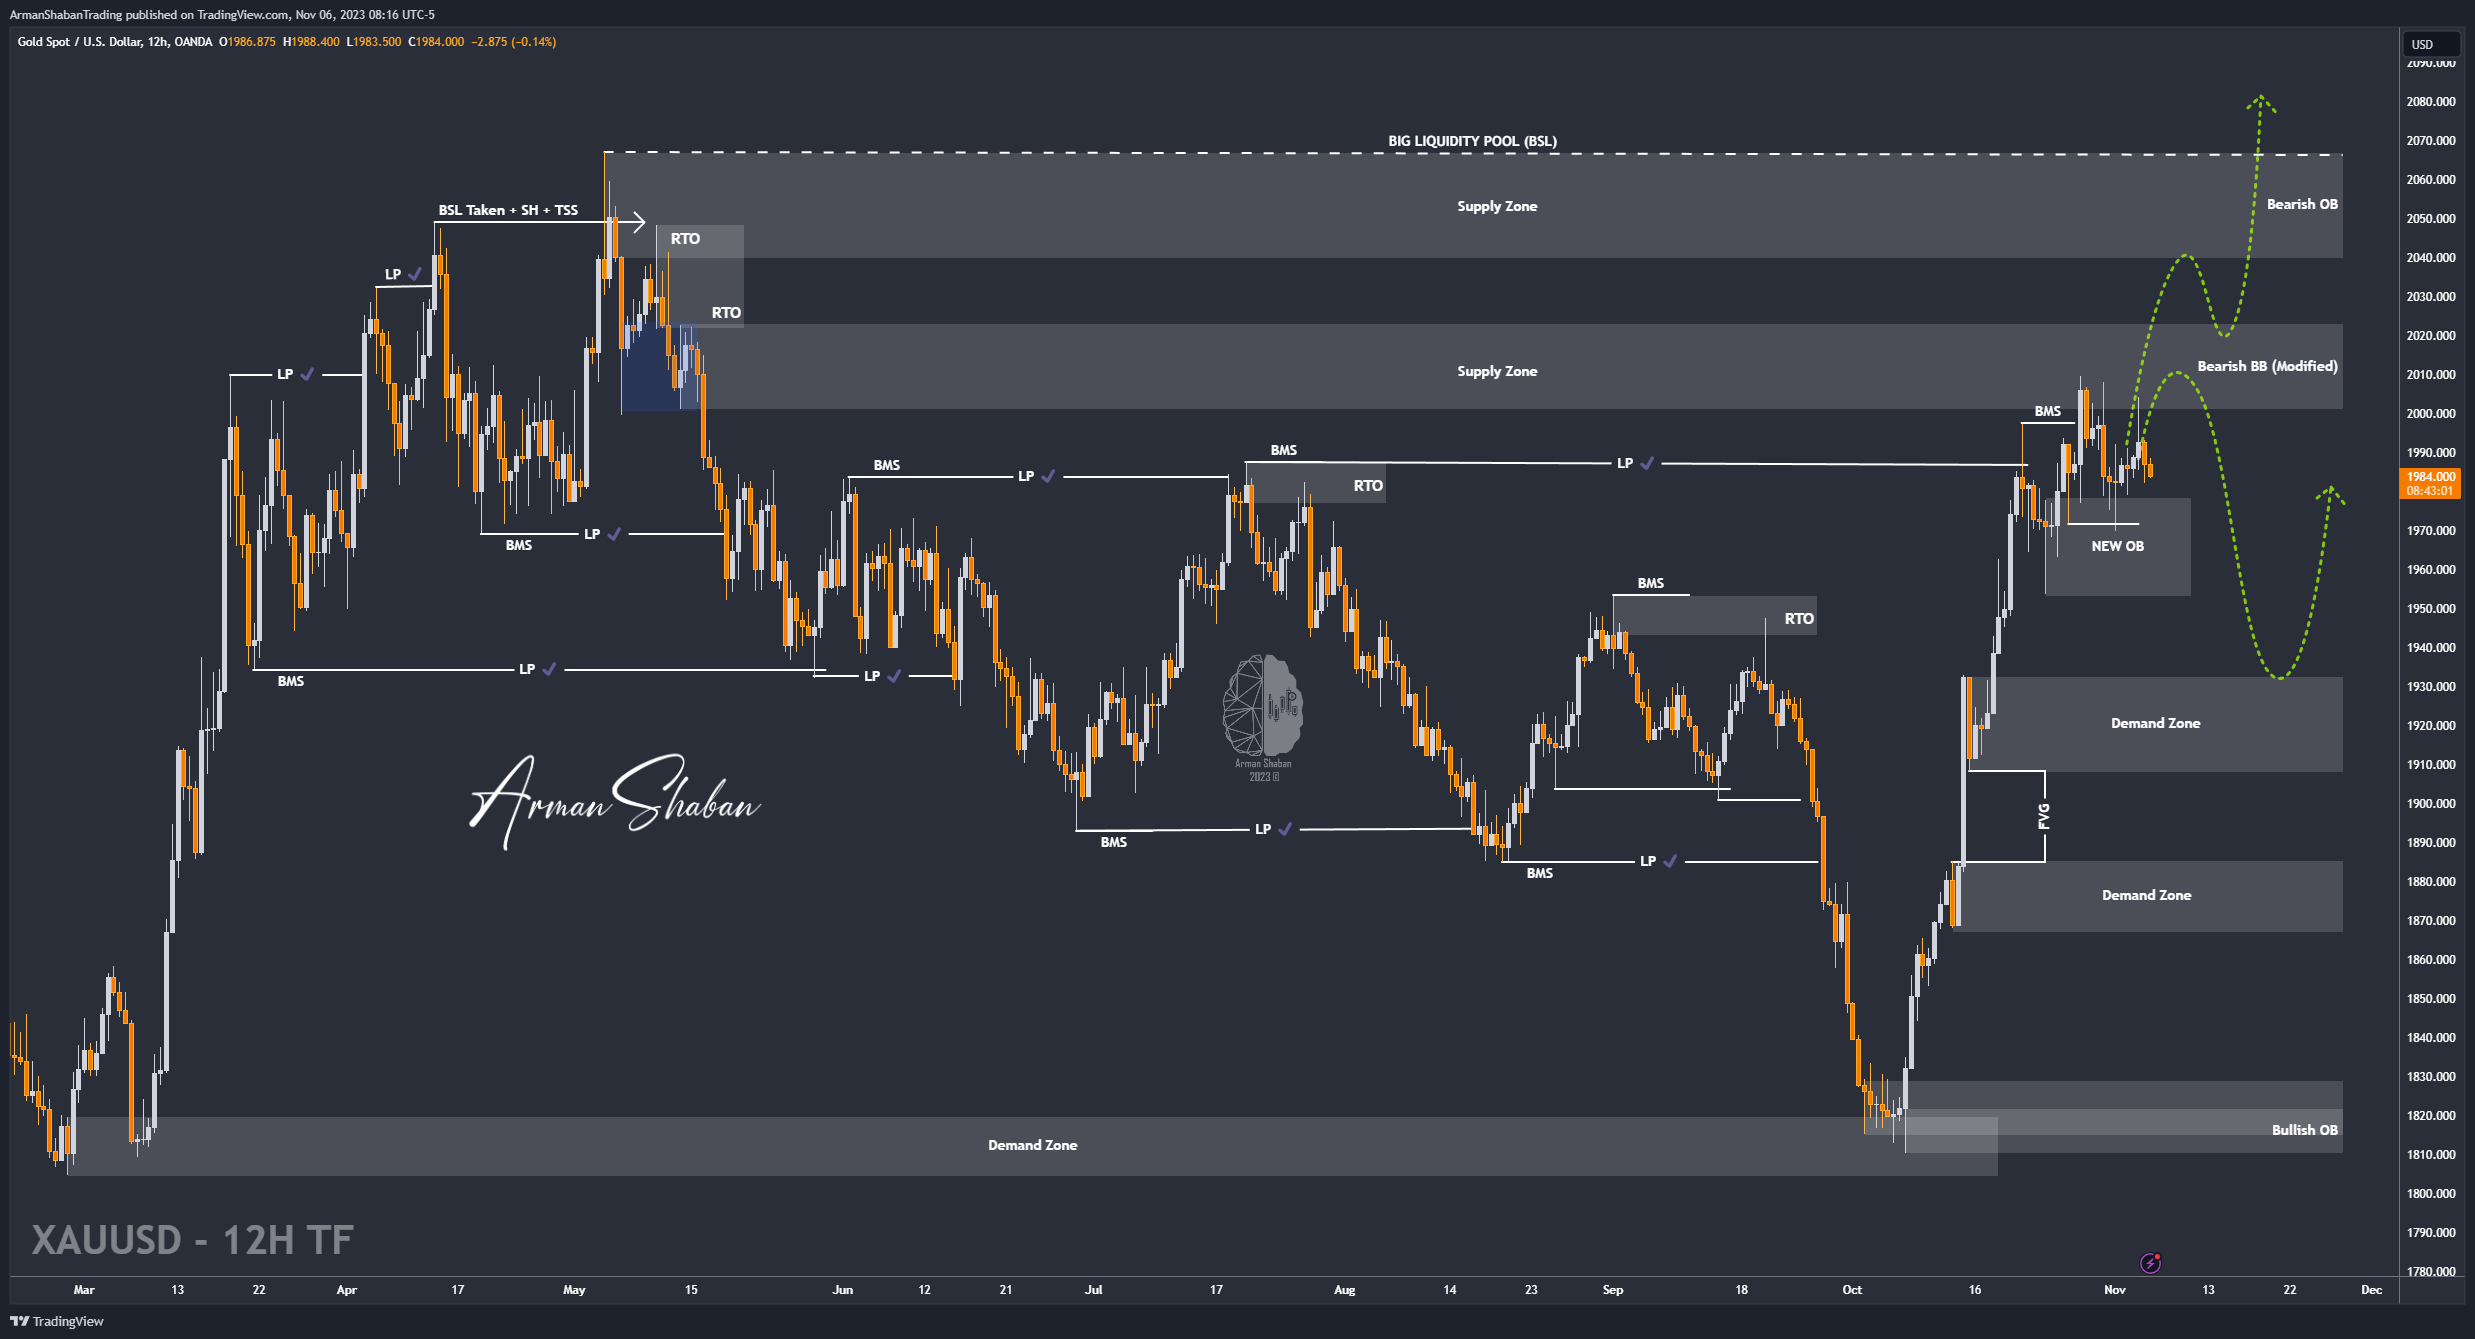
Gold Analysis : By checking the GOLD chart in the 12-hour time frame, we can see that the price is still correcting as we expected and the full explanation we gave on the video on YouTube , and now if it can stabilize below the range of $1991, we will probably see a further correction of the price. If this drop continues, its short-term targets will be $1979 and $1969, respectively! The Bearish scenario will also fail when the price attacks the level of $2000 again and can be closed above $2010 in the 12-hour time frame, which is mentioned in the previous analysis and the video that we posted on YouTube! I hope this analysis is useful for you!
(This Post on TradingView)
Author : Arman Shaban
– Related Ideas :
– XAU/USD (GOLD) : 02.Nov.2023
– XAU/USD (GOLD) : 01.Nov.2023
– XAU/USD (GOLD) : 30.OCT.2023
– XAU/USD (GOLD) : 27.OCT.2023
To see more analyzes of Gold , Forex Pairs , Cryptocurrencies , Indices and Stocks , be sure to Follow and Join us on other Platforms :
– Public Telegram Channel
– YouTube Channel
– TradingView
– X (Twitter)
– How to join our FOREX VIP Channel ?
– How to join our Crypto VIP Channel ?
– CONTACT ME directly on Telegram
4 Responses
[…] Ideas :– XAU/USD (GOLD) : 06.Nov.2023– XAU/USD (GOLD) : 02.Nov.2023– XAU/USD (GOLD) : 01.Nov.2023– XAU/USD (GOLD) : […]
[…] – BTC/USD (BITCOIN) : 02.Nov.2023 […]
[…] – ETH/USD (ETHEREUM) : 02.Nov.2023 […]
[…] (GOLD) : 15.Nov.2023– XAU/USD (GOLD) : 08.Nov.2023– XAU/USD (GOLD) : 07.Nov.2023– XAU/USD (GOLD) : 06.Nov.2023To see more analyzes of Gold , Forex Pairs , Cryptocurrencies , Indices and Stocks , be sure to […]