Gold Analysis – 31.Oct.2024
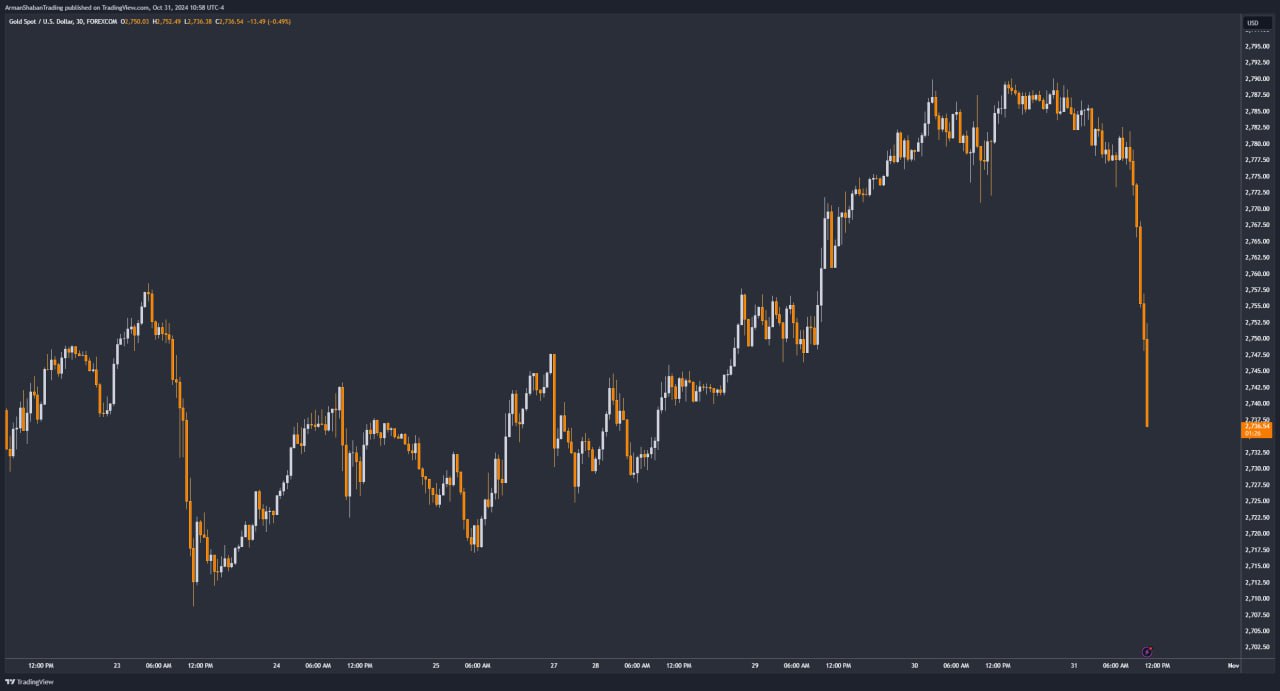
Gold Analysis: By analyzing the #Gold chart in the 15-minute timeframe, we can see that Contrary to our expectations, gold only managed to reach $2782 before quickly rejecting from that area, failing to hit our first target. With recent data releases, including the Core PCE Price Index m/m, Employment Cost Index q/q, and Unemployment Claims, all favoring the dollar, gold began to decline, dropping over $45 from $2782 to $2737. Looking ahead, gold faces demand zones between $2733-$2735 and $2725-$2727. Watch closely to see if these levels will hold and prevent further declines.
(This Post on TradingView)
Author : Arman Shaban
To see more analyzes of Gold , Forex Pairs , Cryptocurrencies , Indices and Stocks , be sure to Follow and Join us on other Platforms :
– Public Telegram Channel
– YouTube Channel
– TradingView
– X (Twitter)
– How to join our FOREX VIP Channel ?
– How to join our Crypto VIP Channel ?
– CONTACT ME directly on Telegram