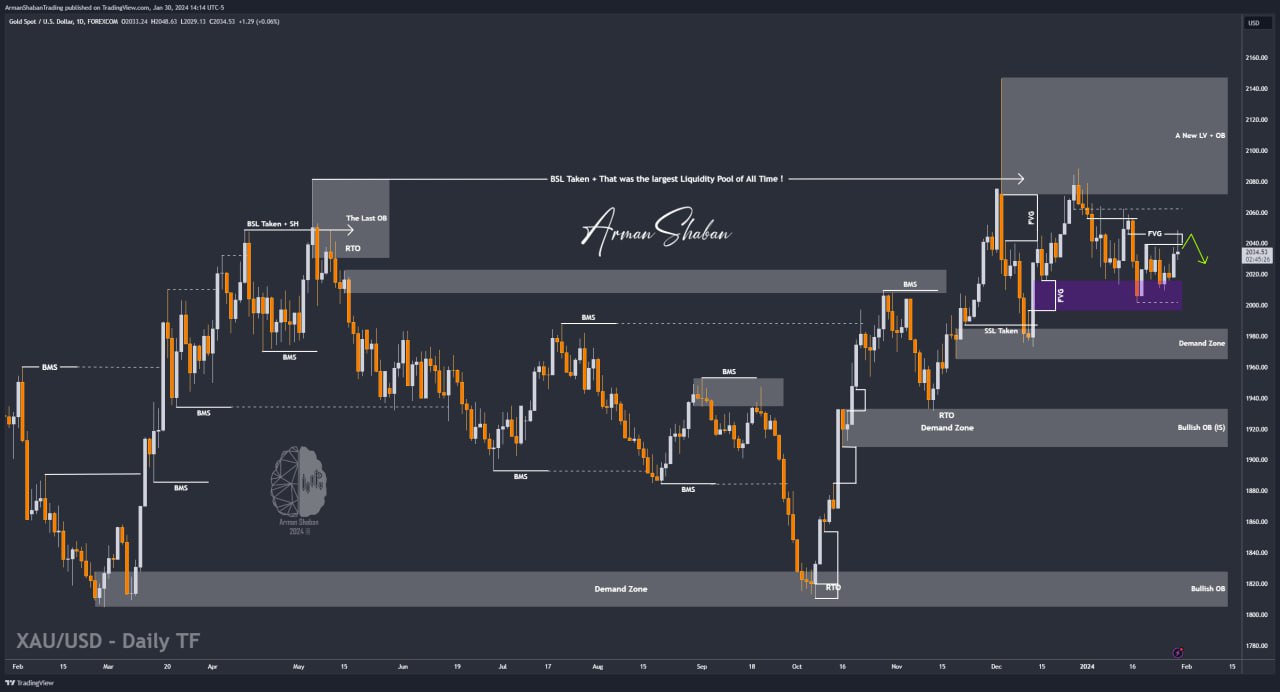
Gold Analysis – 30.Jan.2024

Gold Analysis: By examining the gold chart in the daily time frame, we can see that the price, based on our expectations, faced heavy selling pressure after entering the supply range of $2039 to $2046 and was able to correct by more than 190 pips to $2029. With the heavy fall that gold had, a new liquidity void was created and it created a range with high potential for a SELL position for us, which is between $2046 and $2048! To determine the next trend, it is better to wait until tomorrow and then I will send you my next idea! I hope today’s analysis was useful for you! Thank you for your constant support!
(This Post on TradingView)
Author : Arman Shaban
To see more analyzes of Gold , Forex Pairs , Cryptocurrencies , Indices and Stocks , be sure to Follow and Join us on other Platforms :
– Public Telegram Channel
– YouTube Channel
– TradingView
– X (Twitter)
– How to join our FOREX VIP Channel ?
– How to join our Crypto VIP Channel ?
– CONTACT ME directly on Telegram