Gold Analysis – 29.Oct.2024

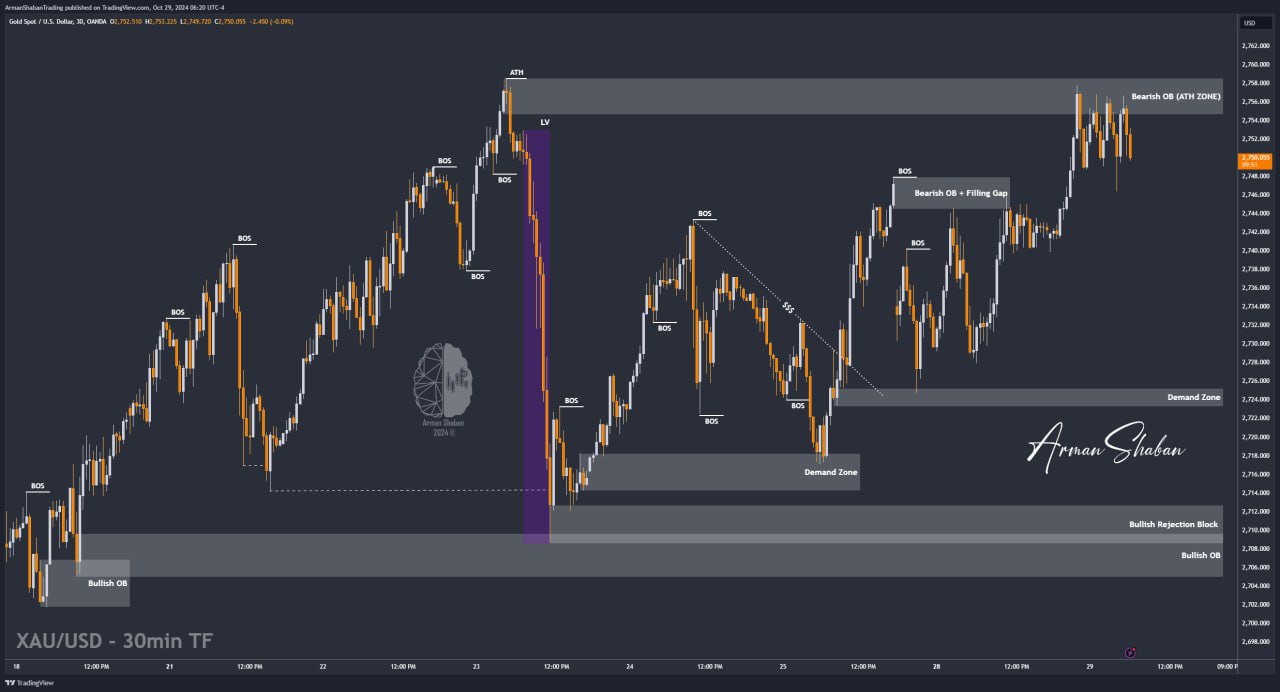
Gold Analysis: By analyzing the #Gold chart in the 30-minute timeframe, we can see that yesterday, gold moved toward the $2745 area to fill the target gap. When the price reached this supply zone, it dropped by over 60 pips, falling to $2739. Following this, news reports suggesting a possible new attack by Israel on Iran led to increased demand for gold, pushing it up near its historical high of $2757. After reaching this important supply level, the price has shown a negative reaction to this level four times so far. At this point, we need to wait for another breakout to be able to predict gold’s next move.
(This Post on TradingView)
Author : Arman Shaban
To see more analyzes of Gold , Forex Pairs , Cryptocurrencies , Indices and Stocks , be sure to Follow and Join us on other Platforms :
– Public Telegram Channel
– YouTube Channel
– TradingView
– X (Twitter)
– How to join our FOREX VIP Channel ?
– How to join our Crypto VIP Channel ?
– CONTACT ME directly on Telegram