Gold Analysis – 29.Apr.2024
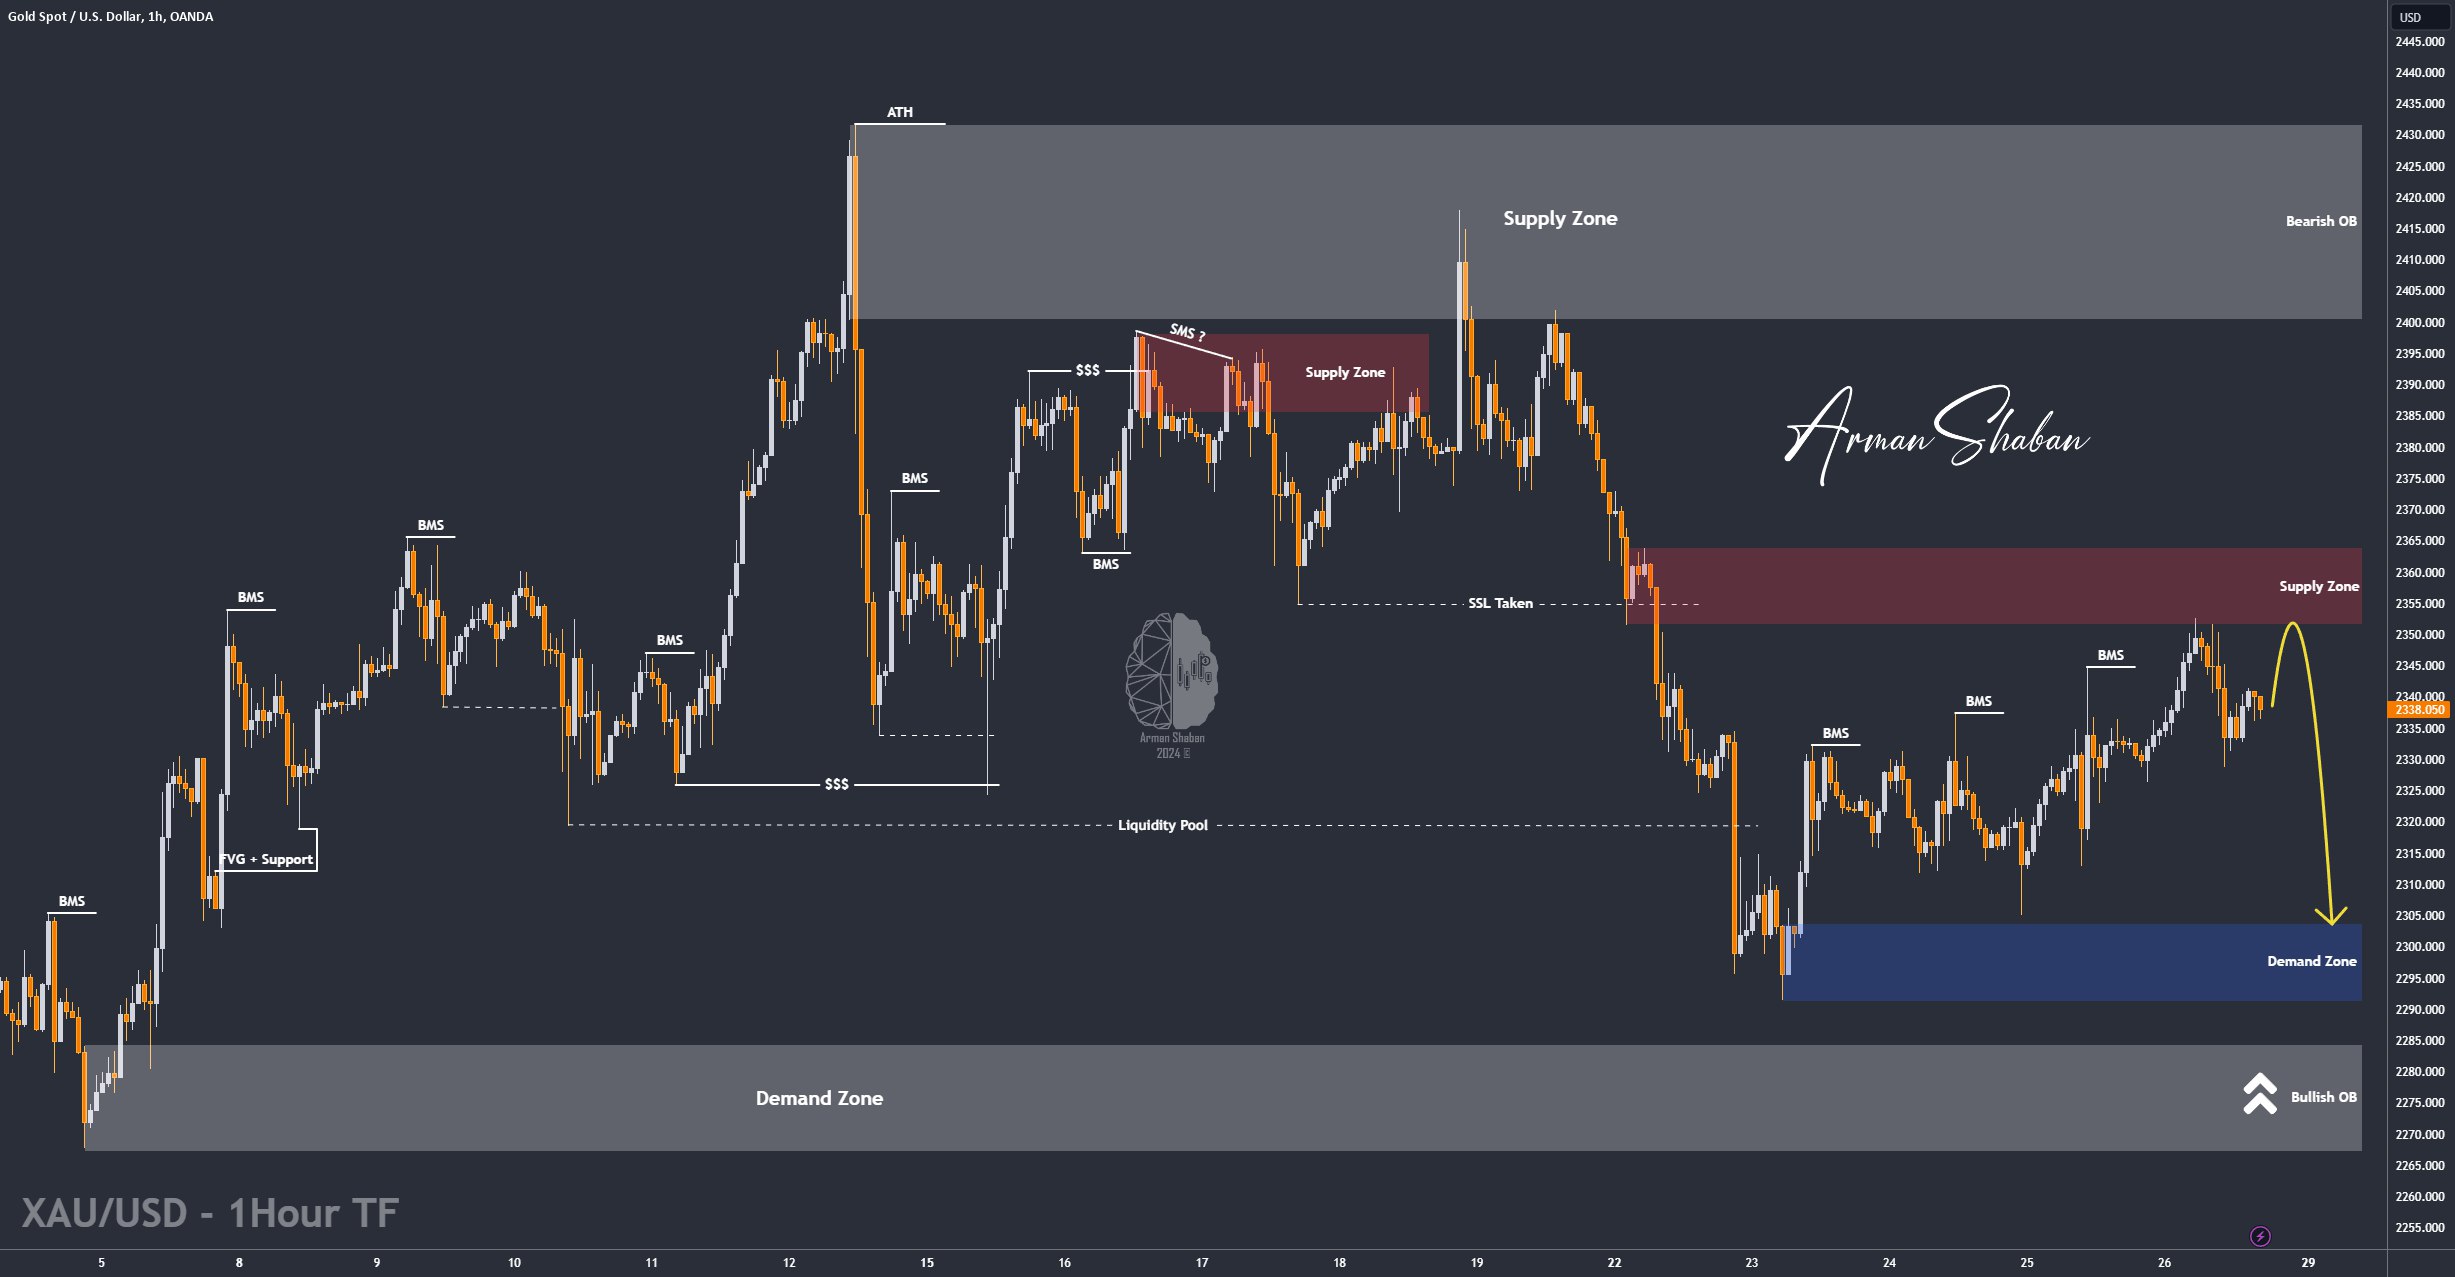
Gold Analysis: Upon examining the gold chart in the 1-hour timeframe, we can see that after the price entered the targeted supply zone ($2352), it faced selling pressure and corrected with a drop of 230 pips down to $2328. Now, gold has closed at $2338, and I expect further correction with the market opening, although it’s possible that the price may re-enter the defined supply zone first before correcting with greater momentum. There are several important price levels ahead for gold that I urge you to consider and mark on your chart; these levels are, in order, $2366, $2375, and $2385. The potential scenario has been outlined on the chart.
(This Post on TradingView)
Author : Arman Shaban
To see more analyzes of Gold , Forex Pairs , Cryptocurrencies , Indices and Stocks , be sure to Follow and Join us on other Platforms :
– Public Telegram Channel
– YouTube Channel
– TradingView
– X (Twitter)
– How to join our FOREX VIP Channel ?
– How to join our Crypto VIP Channel ?
– CONTACT ME directly on Telegram