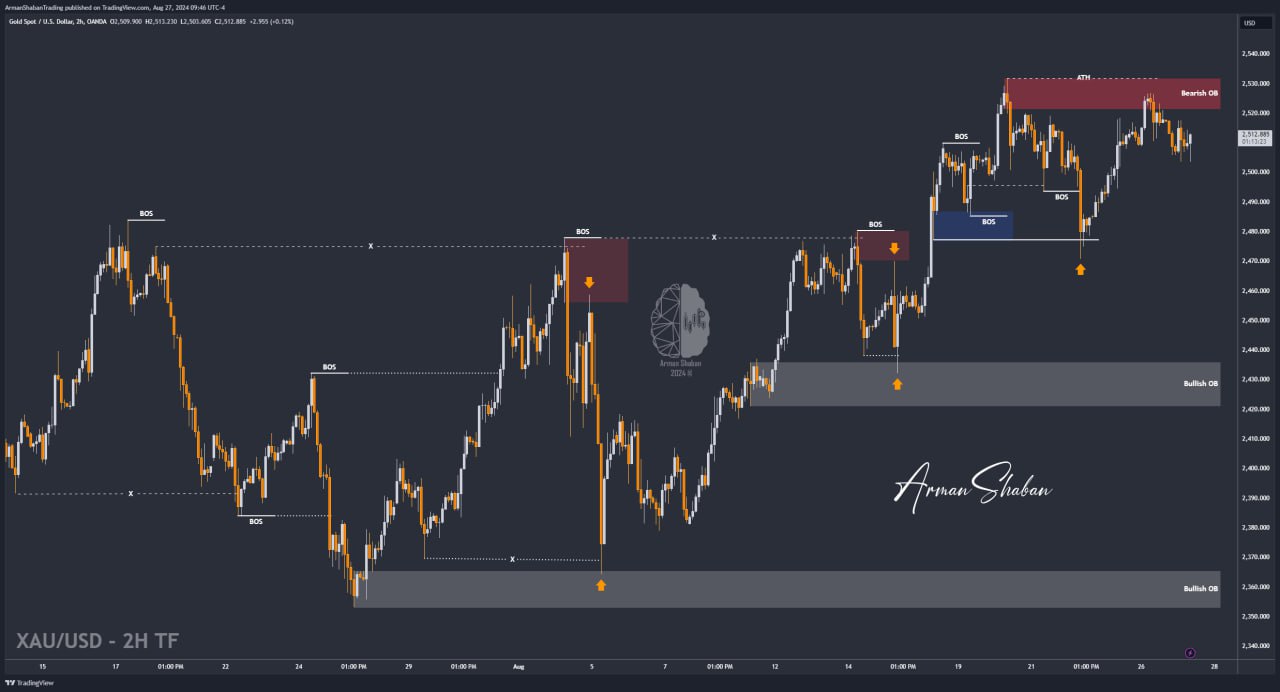
Gold Analysis – 27.Aug.2024

Gold Analysis: By analyzing the #Gold chart on the 2-hour timeframe, we observe that, as expected, the price had an initial negative reaction to the identified supply zone, dropping from $2527 to $2503! The total return so far has been over 230 pips, and currently, gold is trading around the $2510 range. We now need to see if the price can break below $2500 again today or if we should expect a break above the previous high of $2532!
(This Post on TradingView)
Author : Arman Shaban
To see more analyzes of Gold , Forex Pairs , Cryptocurrencies , Indices and Stocks , be sure to Follow and Join us on other Platforms :
– Public Telegram Channel
– YouTube Channel
– TradingView
– X (Twitter)
– How to join our FOREX VIP Channel ?
– How to join our Crypto VIP Channel ?
– CONTACT ME directly on Telegram