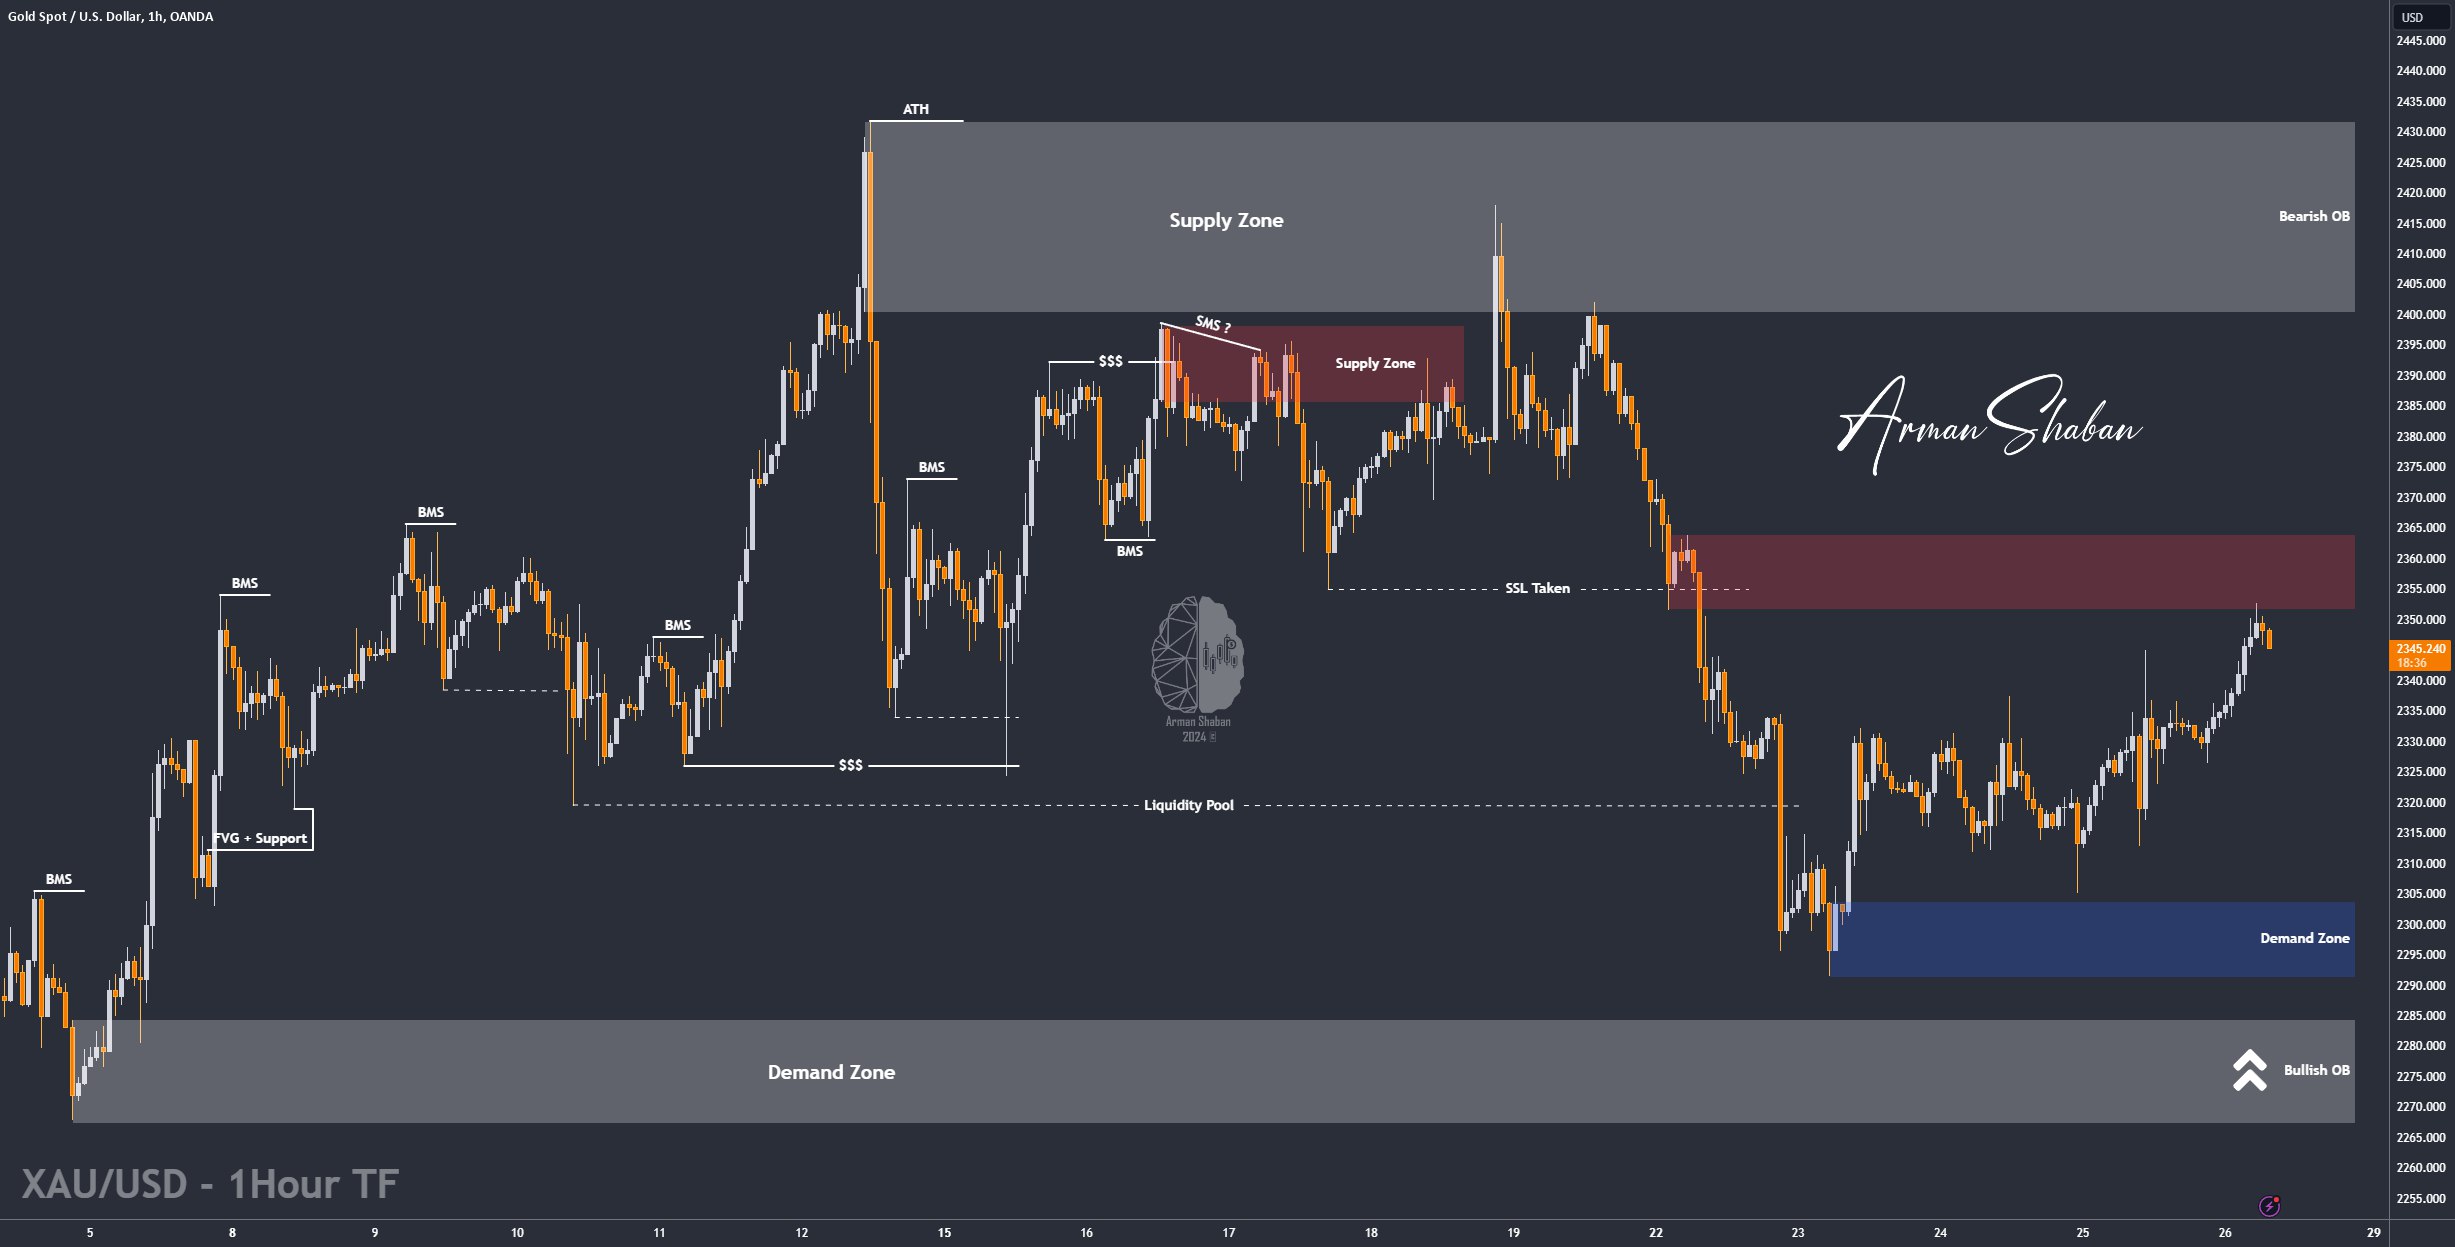
Gold Analysis – 26.Apr.2024

Gold Analysis: By checking the gold chart in the 1-hour time frame, we can see that the price started falling from the range of $2332 last day and corrected to $2312! (+200 Pips) After that, it faced buying pressure again and grew to $2352! There are a series of very important supply levels in front of the price that I want to specify for you!
(This Post on TradingView)
Author : Arman Shaban
To see more analyzes of Gold , Forex Pairs , Cryptocurrencies , Indices and Stocks , be sure to Follow and Join us on other Platforms :
– Public Telegram Channel
– YouTube Channel
– TradingView
– X (Twitter)
– How to join our FOREX VIP Channel ?
– How to join our Crypto VIP Channel ?
– CONTACT ME directly on Telegram
One Response
Muneeb Kamaldien:
Hi. I think there will be more selling towards the end of market. I think it will test 4hr support at 2330-2326.
Closing price: 2327