Gold Analysis – 23.Aug.2024
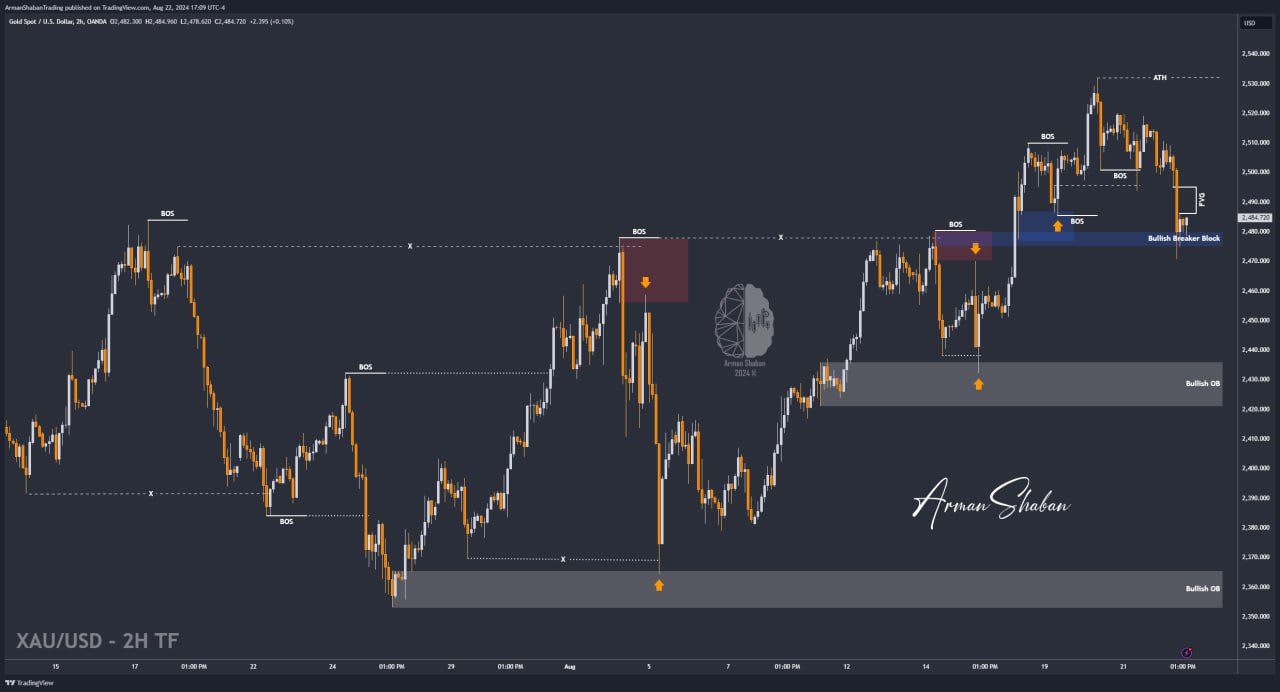
Gold Analysis: By reviewing the gold chart on the 2-hour timeframe, we can see that after our previous analysis, the price rose by about 50 pips and then faced selling pressure again upon reaching the $2510 zone. Following this, the price lost support at $2494 and dropped to $2471. Currently, gold is trading around $2484, and given the recent decline, a new liquidity gap has formed. I expect this Fair Value Gap (FVG) between $2486 and $2495 to be filled in the short term. Therefore, I anticipate a price increase to the specified zone, and once the price enters the $2494 to $2502 range, we can look for triggers to enter a SELL position.
(This Post on TradingView)
Author : Arman Shaban
To see more analyzes of Gold , Forex Pairs , Cryptocurrencies , Indices and Stocks , be sure to Follow and Join us on other Platforms :
– Public Telegram Channel
– YouTube Channel
– TradingView
– X (Twitter)
– How to join our FOREX VIP Channel ?
– How to join our Crypto VIP Channel ?
– CONTACT ME directly on Telegram