Gold Analysis – 20.Sep.2024
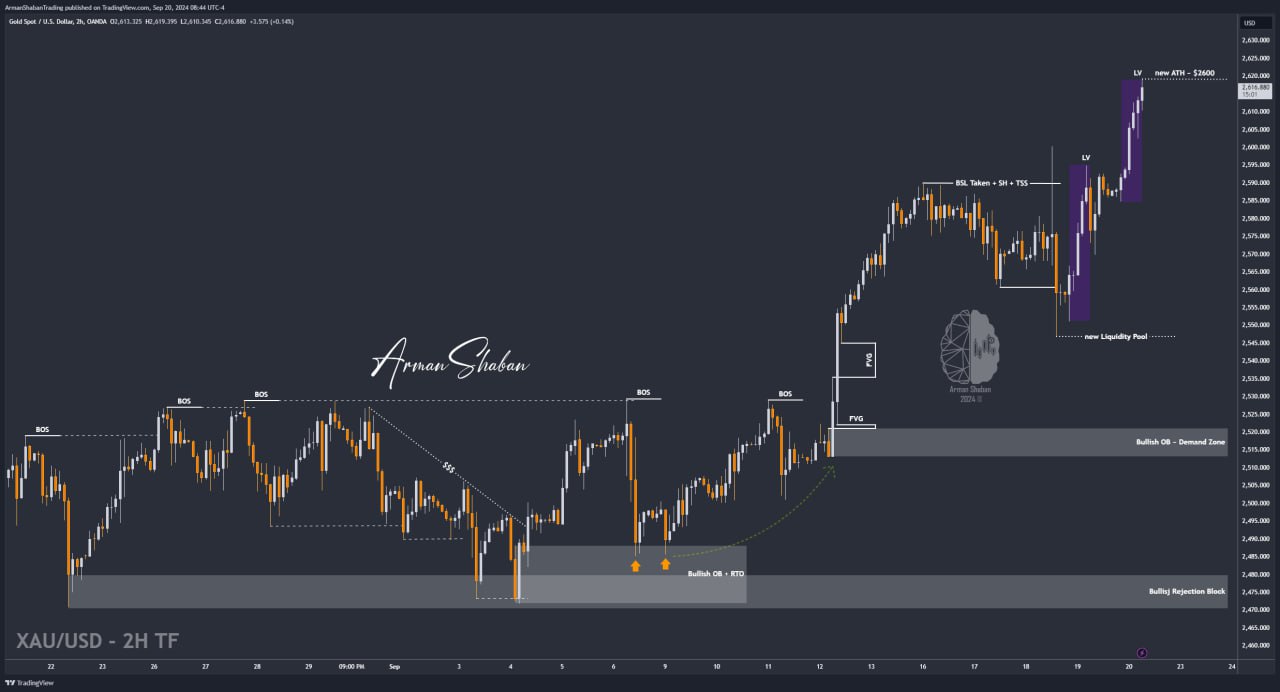
Gold Analysis: Upon analyzing the gold chart on the 2-hour timeframe, we can see that after yesterday’s analysis, the price started dropping exactly as expected and hit nearly all three targets (the final target was $2,567, and gold managed to drop to $2,569). After this drop, gold saw renewed demand and today was able to climb up to $2,619, setting a new All Time High. Currently, there are no signs on the chart that indicate a corrective move (Reversal), so be patient until the market gives you a good entry and don’t increase your risk. This analysis will be updated again, so stay tuned! I hope you made the most out of this analysis (Total return: +170 pips).
(This Post on TradingView)
Author : Arman Shaban
To see more analyzes of Gold , Forex Pairs , Cryptocurrencies , Indices and Stocks , be sure to Follow and Join us on other Platforms :
– Public Telegram Channel
– YouTube Channel
– TradingView
– X (Twitter)
– How to join our FOREX VIP Channel ?
– How to join our Crypto VIP Channel ?
– CONTACT ME directly on Telegram