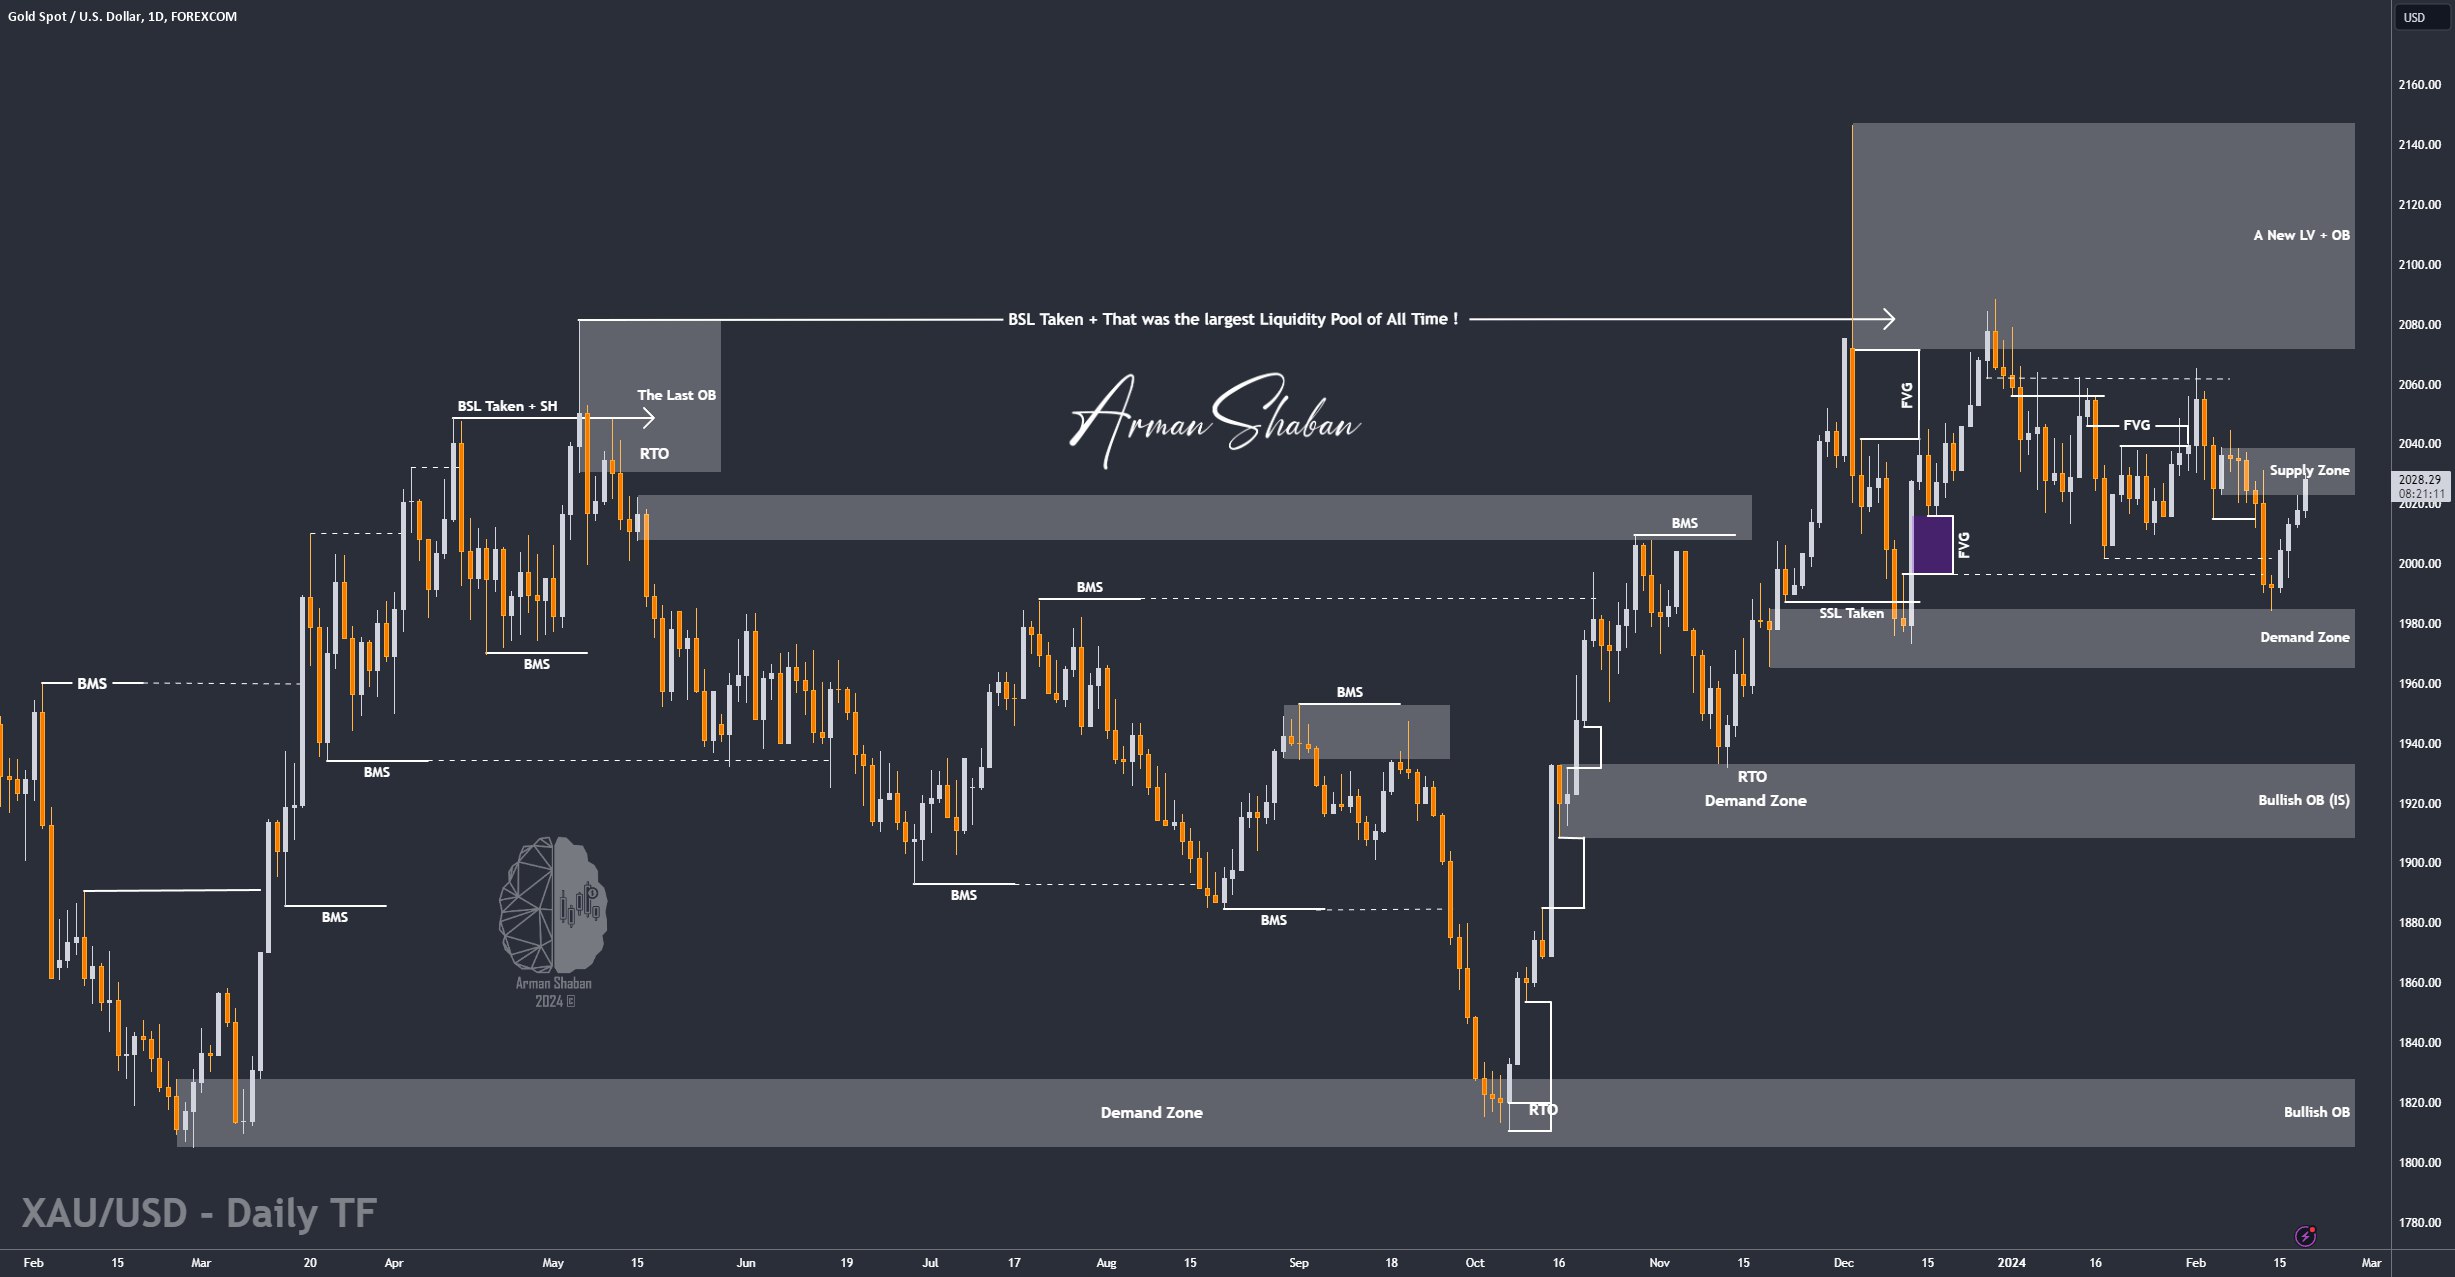
Gold Analysis – 20.Feb.2024

Gold Analysis: By checking the gold chart in the daily time frame, we can see that the price has come back with the demand after the fall from $2023 to $2013, and we see that it has now reached the range of $2030! Monitor the range of $2032 to $2038 for SELL and wait for the right trigger to enter!
(This Post on TradingView)
Author : Arman Shaban
To see more analyzes of Gold , Forex Pairs , Cryptocurrencies , Indices and Stocks , be sure to Follow and Join us on other Platforms :
– Public Telegram Channel
– YouTube Channel
– TradingView
– X (Twitter)
– How to join our FOREX VIP Channel ?
– How to join our Crypto VIP Channel ?
– CONTACT ME directly on Telegram