Gold Analysis – 19.Jun.2026
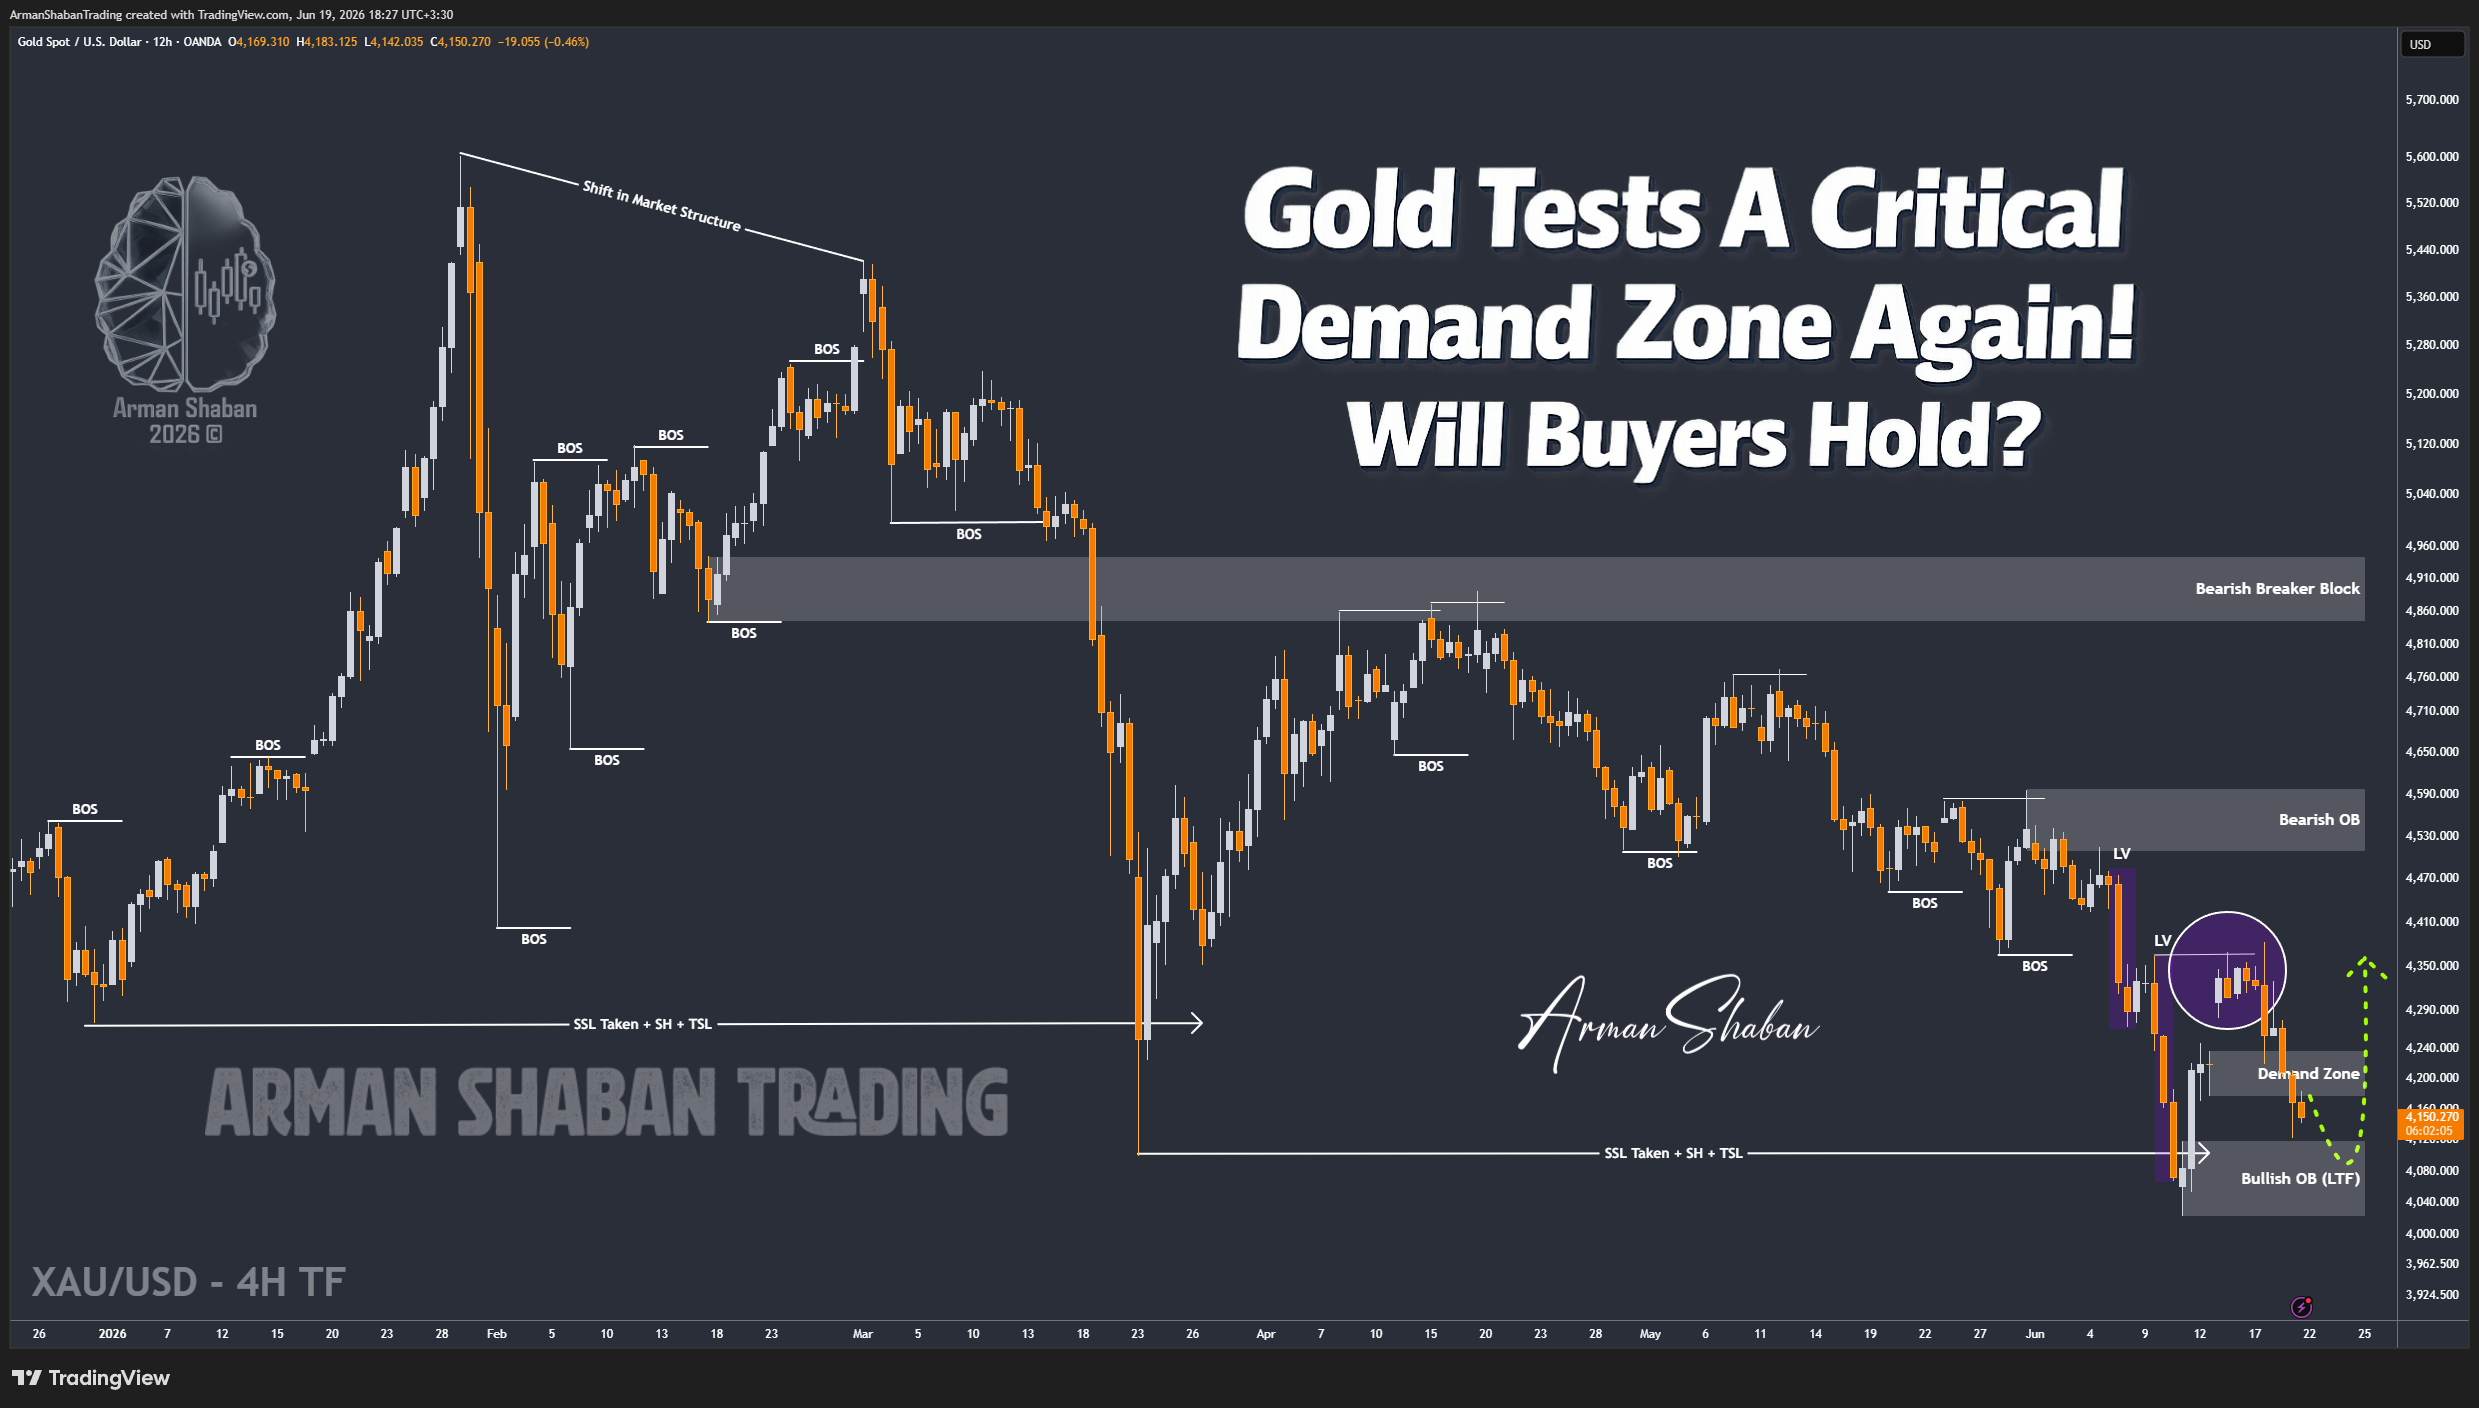
Gold Analysis: By analyzing the #Gold chart on the 4H timeframe, we can see that after our previous update, Gold extended its decline and pushed into lower demand levels. Once price reached the $4123 region, buyers stepped in aggressively and triggered a rebound toward $4183.
However, bulls failed to maintain control and sellers regained momentum once again, pushing Gold back toward the $4145 area. This confirms that bears are still active and that the market remains under heavy selling pressure.
From a structural perspective, the key level to watch now is the major demand zone around $4119. Whether buyers can successfully defend this area or not will likely determine the next major move.
The nearest demand zones are located around $4119 – $4140, followed by deeper structural support between $4050 – $4080. On the upside, the closest supply zones are located around $4180 – $4200, followed by a stronger resistance cluster between $4230 – $4255.
In my view, traders should closely monitor price behavior around the $4119 region. If Gold manages to stabilize above this area, another short-term recovery could develop. However, a decisive break below this key support would expose lower liquidity levels and increase the probability of another bearish leg.
For now, the reaction around this critical zone remains the most important factor to watch.
(This Post on TradingView)
Author : Arman Shaban
To see more analyzes of Gold , Forex Pairs , Cryptocurrencies , Indices and Stocks , be sure to Follow and Join us on other Platforms :
– Public Telegram Channel
– YouTube Channel
– TradingView
– X (Twitter)
– How to join our FOREX VIP Channel ?
– How to join our Crypto VIP Channel ?
– CONTACT ME directly on Telegram