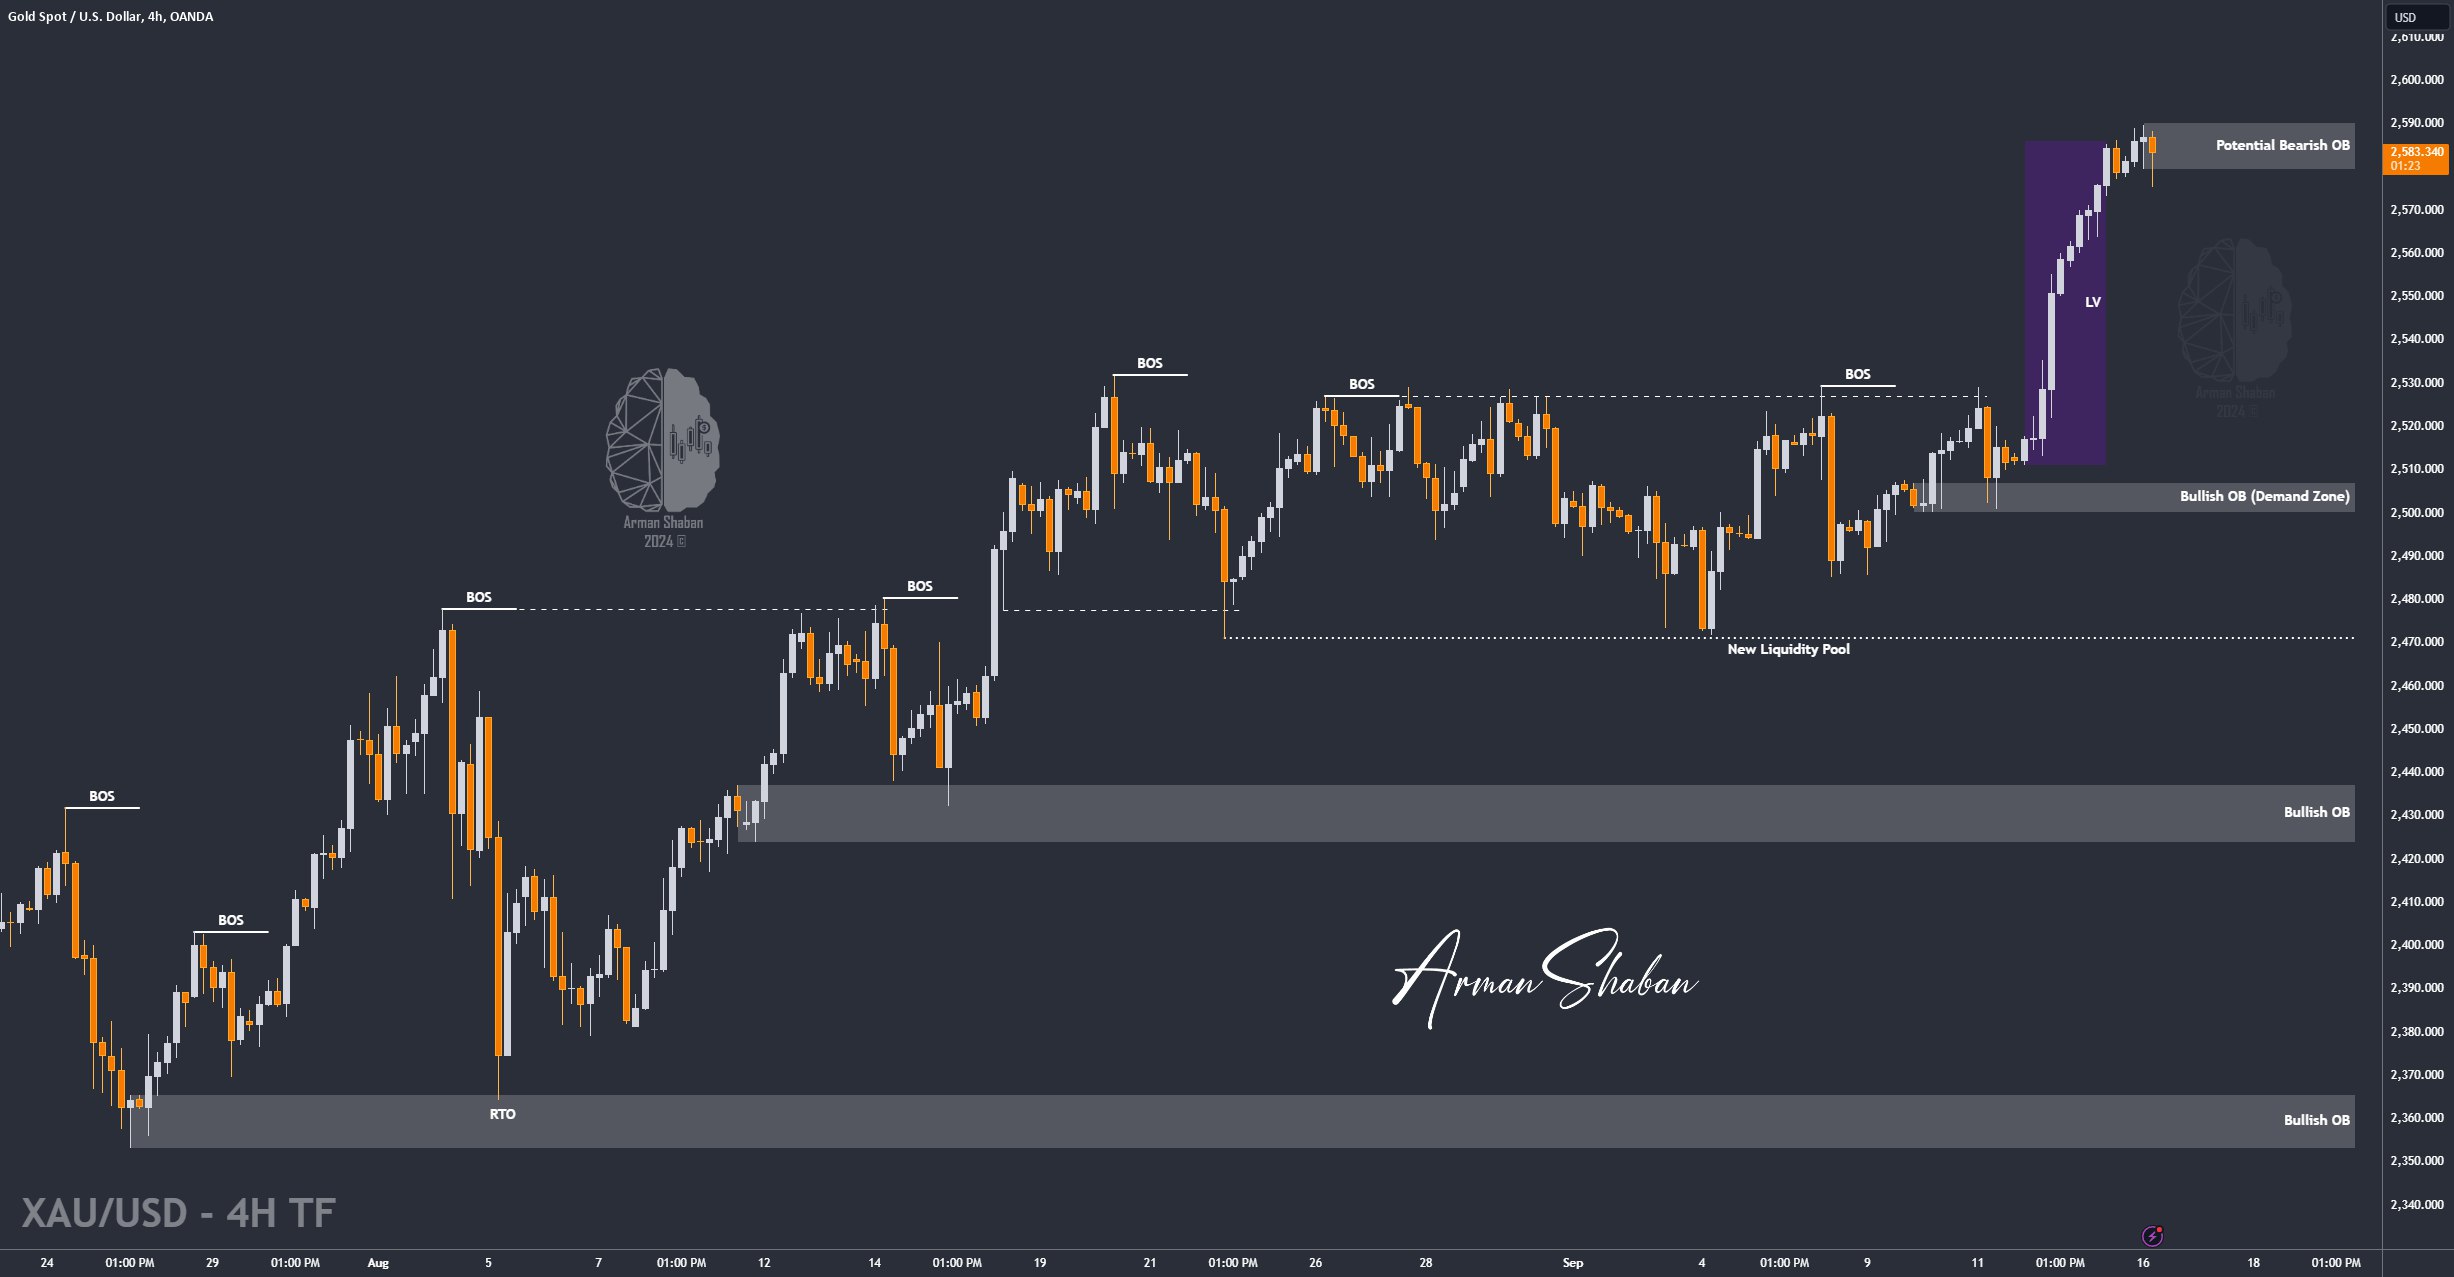
Gold Analysis – 16.Sep.2024

Gold Analysis: By analyzing the gold chart on the 4-hour timeframe, we can see that today the price managed to reach a new All Time High, climbing up to $2589.750. Afterward, it faced a correction and is currently trading around the $2580 level. If the 4-hour gold candle closes below $2579, we can consider the $2579 to $2589 range as a Bearish Order Bock. Based on this, we can analyze and predict the next price movements. Continue to wait for price stabilization and avoid taking high-risk trades. (This analysis will be updated)
(This Post on TradingView)
Author : Arman Shaban
To see more analyzes of Gold , Forex Pairs , Cryptocurrencies , Indices and Stocks , be sure to Follow and Join us on other Platforms :
– Public Telegram Channel
– YouTube Channel
– TradingView
– X (Twitter)
– How to join our FOREX VIP Channel ?
– How to join our Crypto VIP Channel ?
– CONTACT ME directly on Telegram