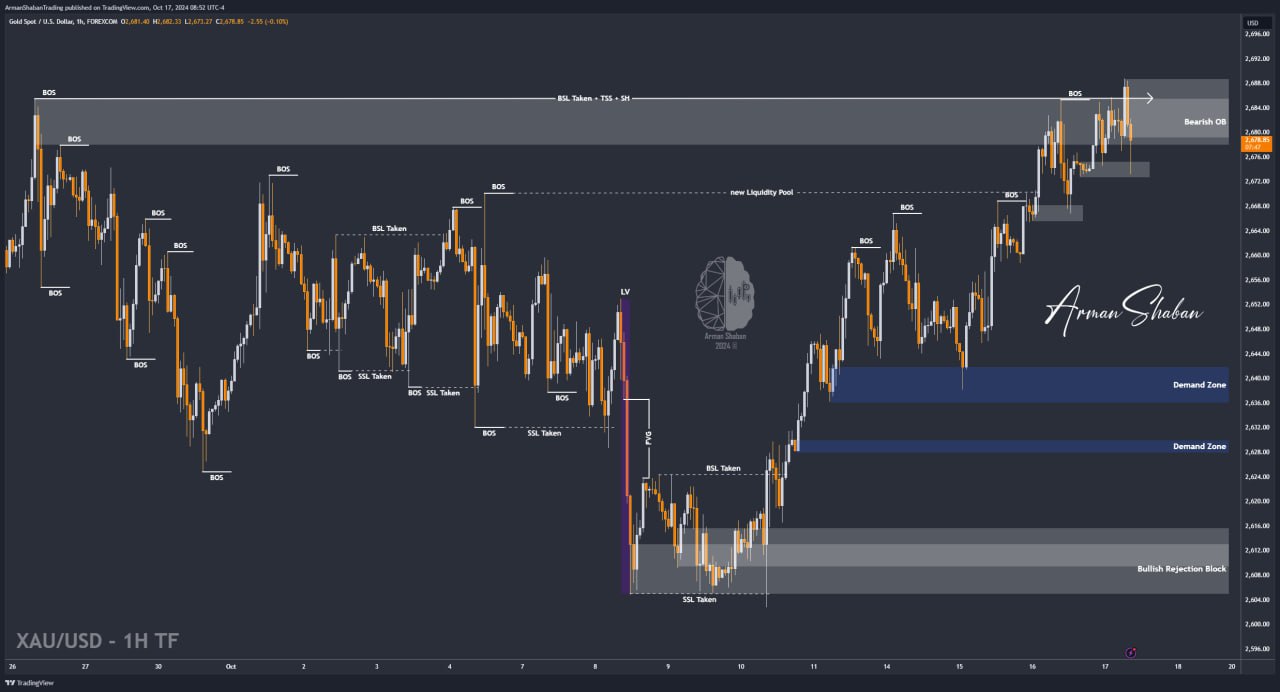
Gold Analysis – 17.Oct.2024

Gold Analysis: Upon reviewing the gold chart on the 1-hour timeframe, we can see that as expected, gold rose again above $2680 yesterday, with several attempts to break the previous high. Finally, two hours ago, gold surged to $2688.8, collecting liquidity above that level before undergoing a correction down to $2673. As marked on the chart, the $2673-$2675 area is a key demand zone, which is why the price reacted to it, and it is currently trading around $2678. If the price holds above $2675, we may see gold rising again. As I mentioned in the previous analysis, I expect gold to rise above $2700 in the short term. Stay tuned for price stabilization. This analysis will be updated.
(This Post on TradingView)
Author : Arman Shaban
To see more analyzes of Gold , Forex Pairs , Cryptocurrencies , Indices and Stocks , be sure to Follow and Join us on other Platforms :
– Public Telegram Channel
– YouTube Channel
– TradingView
– X (Twitter)
– How to join our FOREX VIP Channel ?
– How to join our Crypto VIP Channel ?
– CONTACT ME directly on Telegram