Gold Analysis – 17.Feb.2025
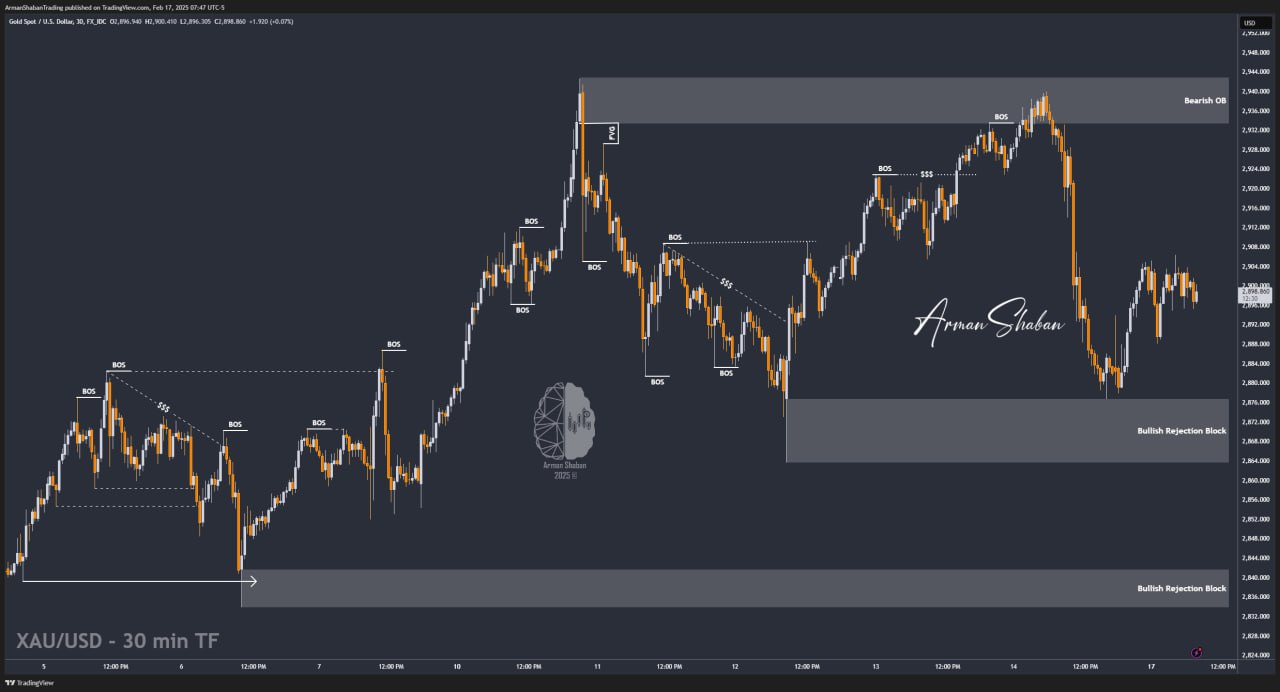
Gold Analysis: By analyzing the 30-minute gold chart, we can see that on Friday, gold started its expected correction from the $2,930 zone, hitting the first corrective target at $2,923. This bearish move continued strongly, delivering over 500 pips in profit, reaching as low as $2,876! As seen on the chart, the $2,876 – $2,841 zone was a Bullish Rejection Block, and just as expected, gold gained buying pressure upon reaching this level, pushing back up to $2,906. Currently, gold is trading around $2,899, and $2,902.5 has now turned into a key resistance level that could determine the next move. If gold breaks and stabilizes above $2,902.5, the next targets are $2,914 and $2,919. Failure to break this level could lead to further consolidation or another pullback. This analysis will be updated as price action unfolds! Stay tuned!
(This Post on TradingView)
Author : Arman Shaban
To see more analyzes of Gold , Forex Pairs , Cryptocurrencies , Indices and Stocks , be sure to Follow and Join us on other Platforms :
– Public Telegram Channel
– YouTube Channel
– TradingView
– X (Twitter)
– How to join our FOREX VIP Channel ?
– How to join our Crypto VIP Channel ?
– CONTACT ME directly on Telegram