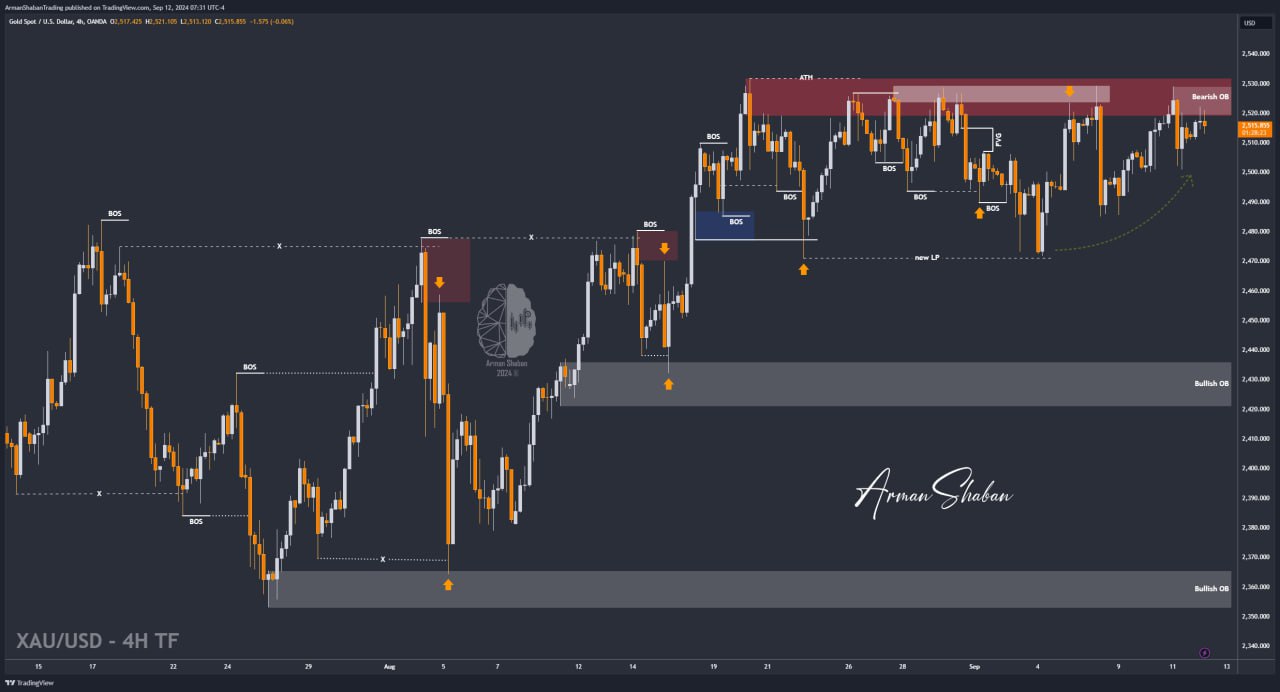
Gold Analysis – 12.Sep.2024

Gold Analysis: By analyzing the gold chart on the 4-hour timeframe, we can see that, as expected, the price started to rise and filled the liquidity gap between the $2512 and $2520 levels. When the price reached the supply level at $2520, it faced selling pressure and corrected down to $2513! So far, this analysis has yielded over 220 pips in profit. If the price stabilizes below the $2520 area, we can expect further decline in gold. However, as I mentioned in the previous analysis, considering the weakening of this significant resistance level due to repeated tests over the past 18 days, I expect that after an initial price correction, we will soon see a breakout above the $2532 resistance, and I anticipate the price reaching $2550 in the medium term.
(This Post on TradingView)
Author : Arman Shaban
To see more analyzes of Gold , Forex Pairs , Cryptocurrencies , Indices and Stocks , be sure to Follow and Join us on other Platforms :
– Public Telegram Channel
– YouTube Channel
– TradingView
– X (Twitter)
– How to join our FOREX VIP Channel ?
– How to join our Crypto VIP Channel ?
– CONTACT ME directly on Telegram