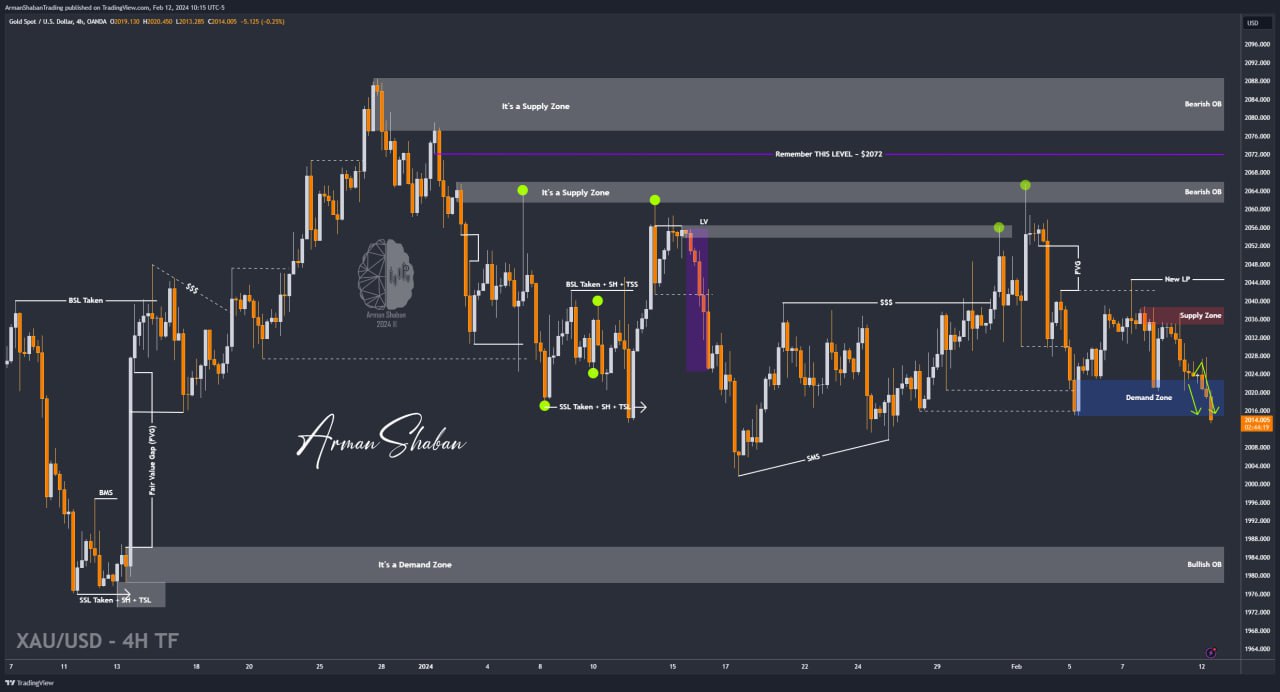
Gold Analysis – 12.Feb.2024

Gold Analysis: By checking the gold chart in the 4-hour time frame, we can see that the price, as we expected, first grew up to $2027 to collect liquidity, and then started to fall, which managed to hit the target of $2020 and $2016, and even Corrected up to $2013! The efficiency of this analysis has been more than 140 pips so far and I hope you have made the most of it! The Main analysis is still valid! Be sure to monitor the ranges of 2002$ to 2007$, 1997$ and 1979$ to 1986$ and the possible price reaction to them in the medium term!
(This Post on TradingView)
Author : Arman Shaban
To see more analyzes of Gold , Forex Pairs , Cryptocurrencies , Indices and Stocks , be sure to Follow and Join us on other Platforms :
– Public Telegram Channel
– YouTube Channel
– TradingView
– X (Twitter)
– How to join our FOREX VIP Channel ?
– How to join our Crypto VIP Channel ?
– CONTACT ME directly on Telegram