Gold Analysis – 11.Feb.2026
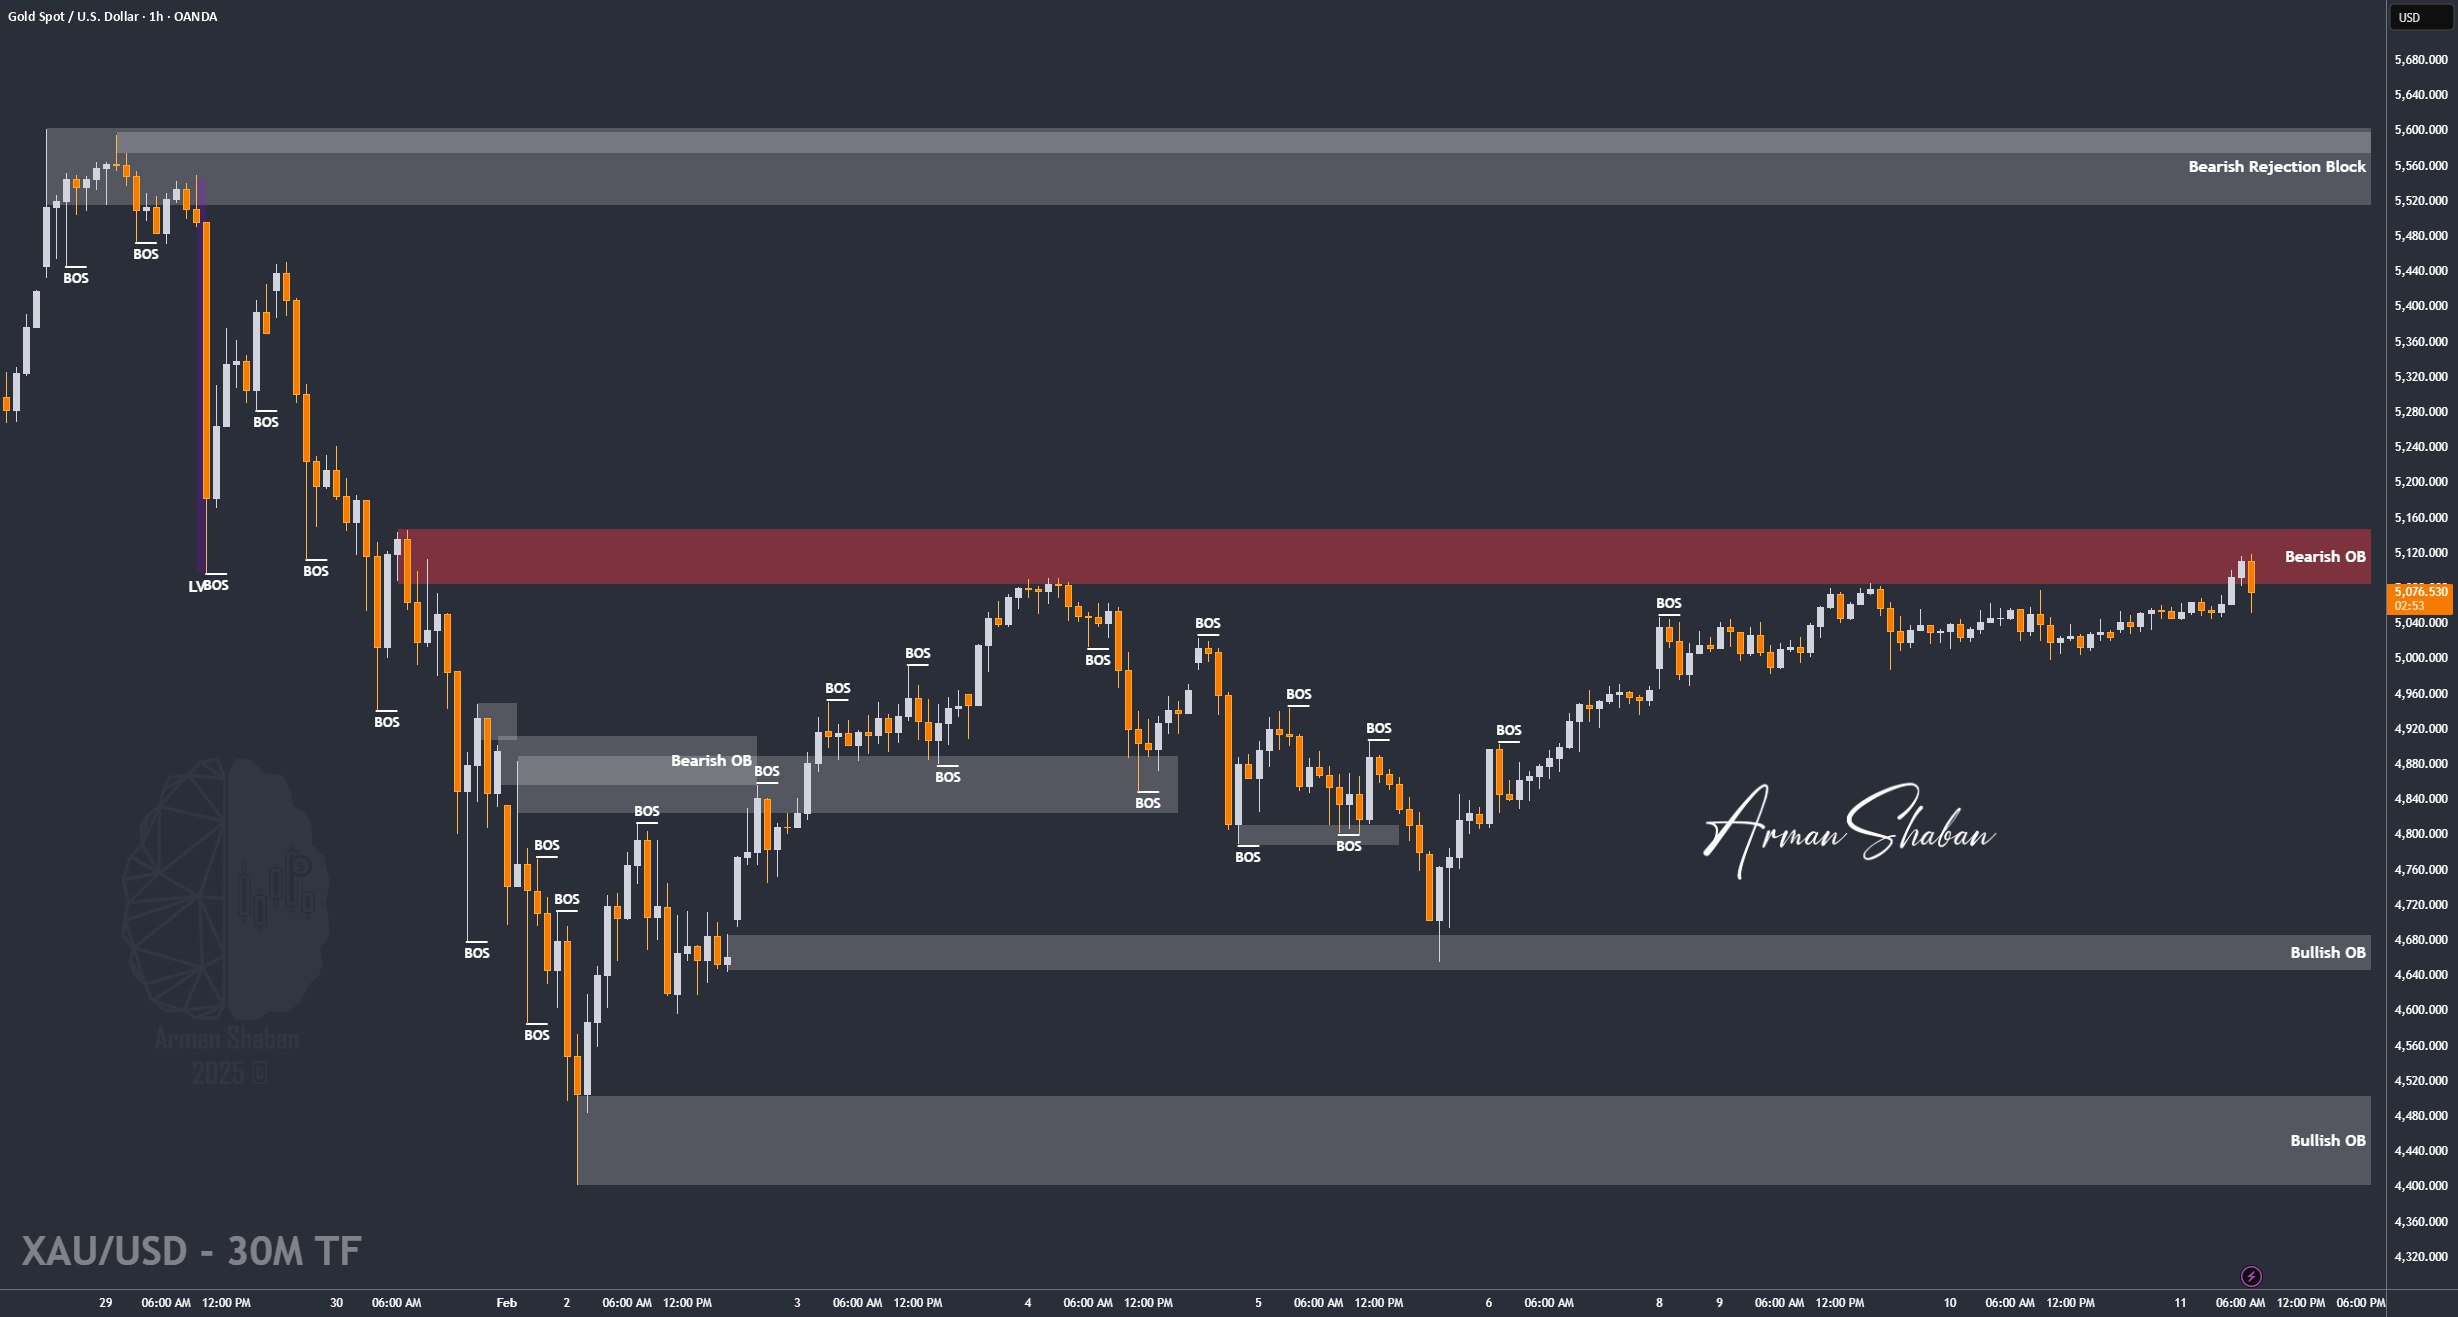
Gold Analysis: By analyzing the #Gold chart on the 1-hour timeframe, we can see that after a small pullback yesterday, price made a strong move toward the $5086 resistance. Gold successfully broke this level and rallied up to $5121.
After reaching this important zone, price faced selling pressure and is now trading around $5076.
Key demand zones are $5026, $5050, and $5059.
Key supply zones are $5092–$5099 and $5111–$5121.
If Gold manages to break and hold above the $5120 zone, we can expect further upside toward $5146.
Keep a close eye on price reaction at each of these zones. This analysis will be updated soon.
(This Post on TradingView)
Author : Arman Shaban
To see more analyzes of Gold , Forex Pairs , Cryptocurrencies , Indices and Stocks , be sure to Follow and Join us on other Platforms :
– Public Telegram Channel
– YouTube Channel
– TradingView
– X (Twitter)
– How to join our FOREX VIP Channel ?
– How to join our Crypto VIP Channel ?
– CONTACT ME directly on Telegram