Gold Analysis – 11.Feb.2026
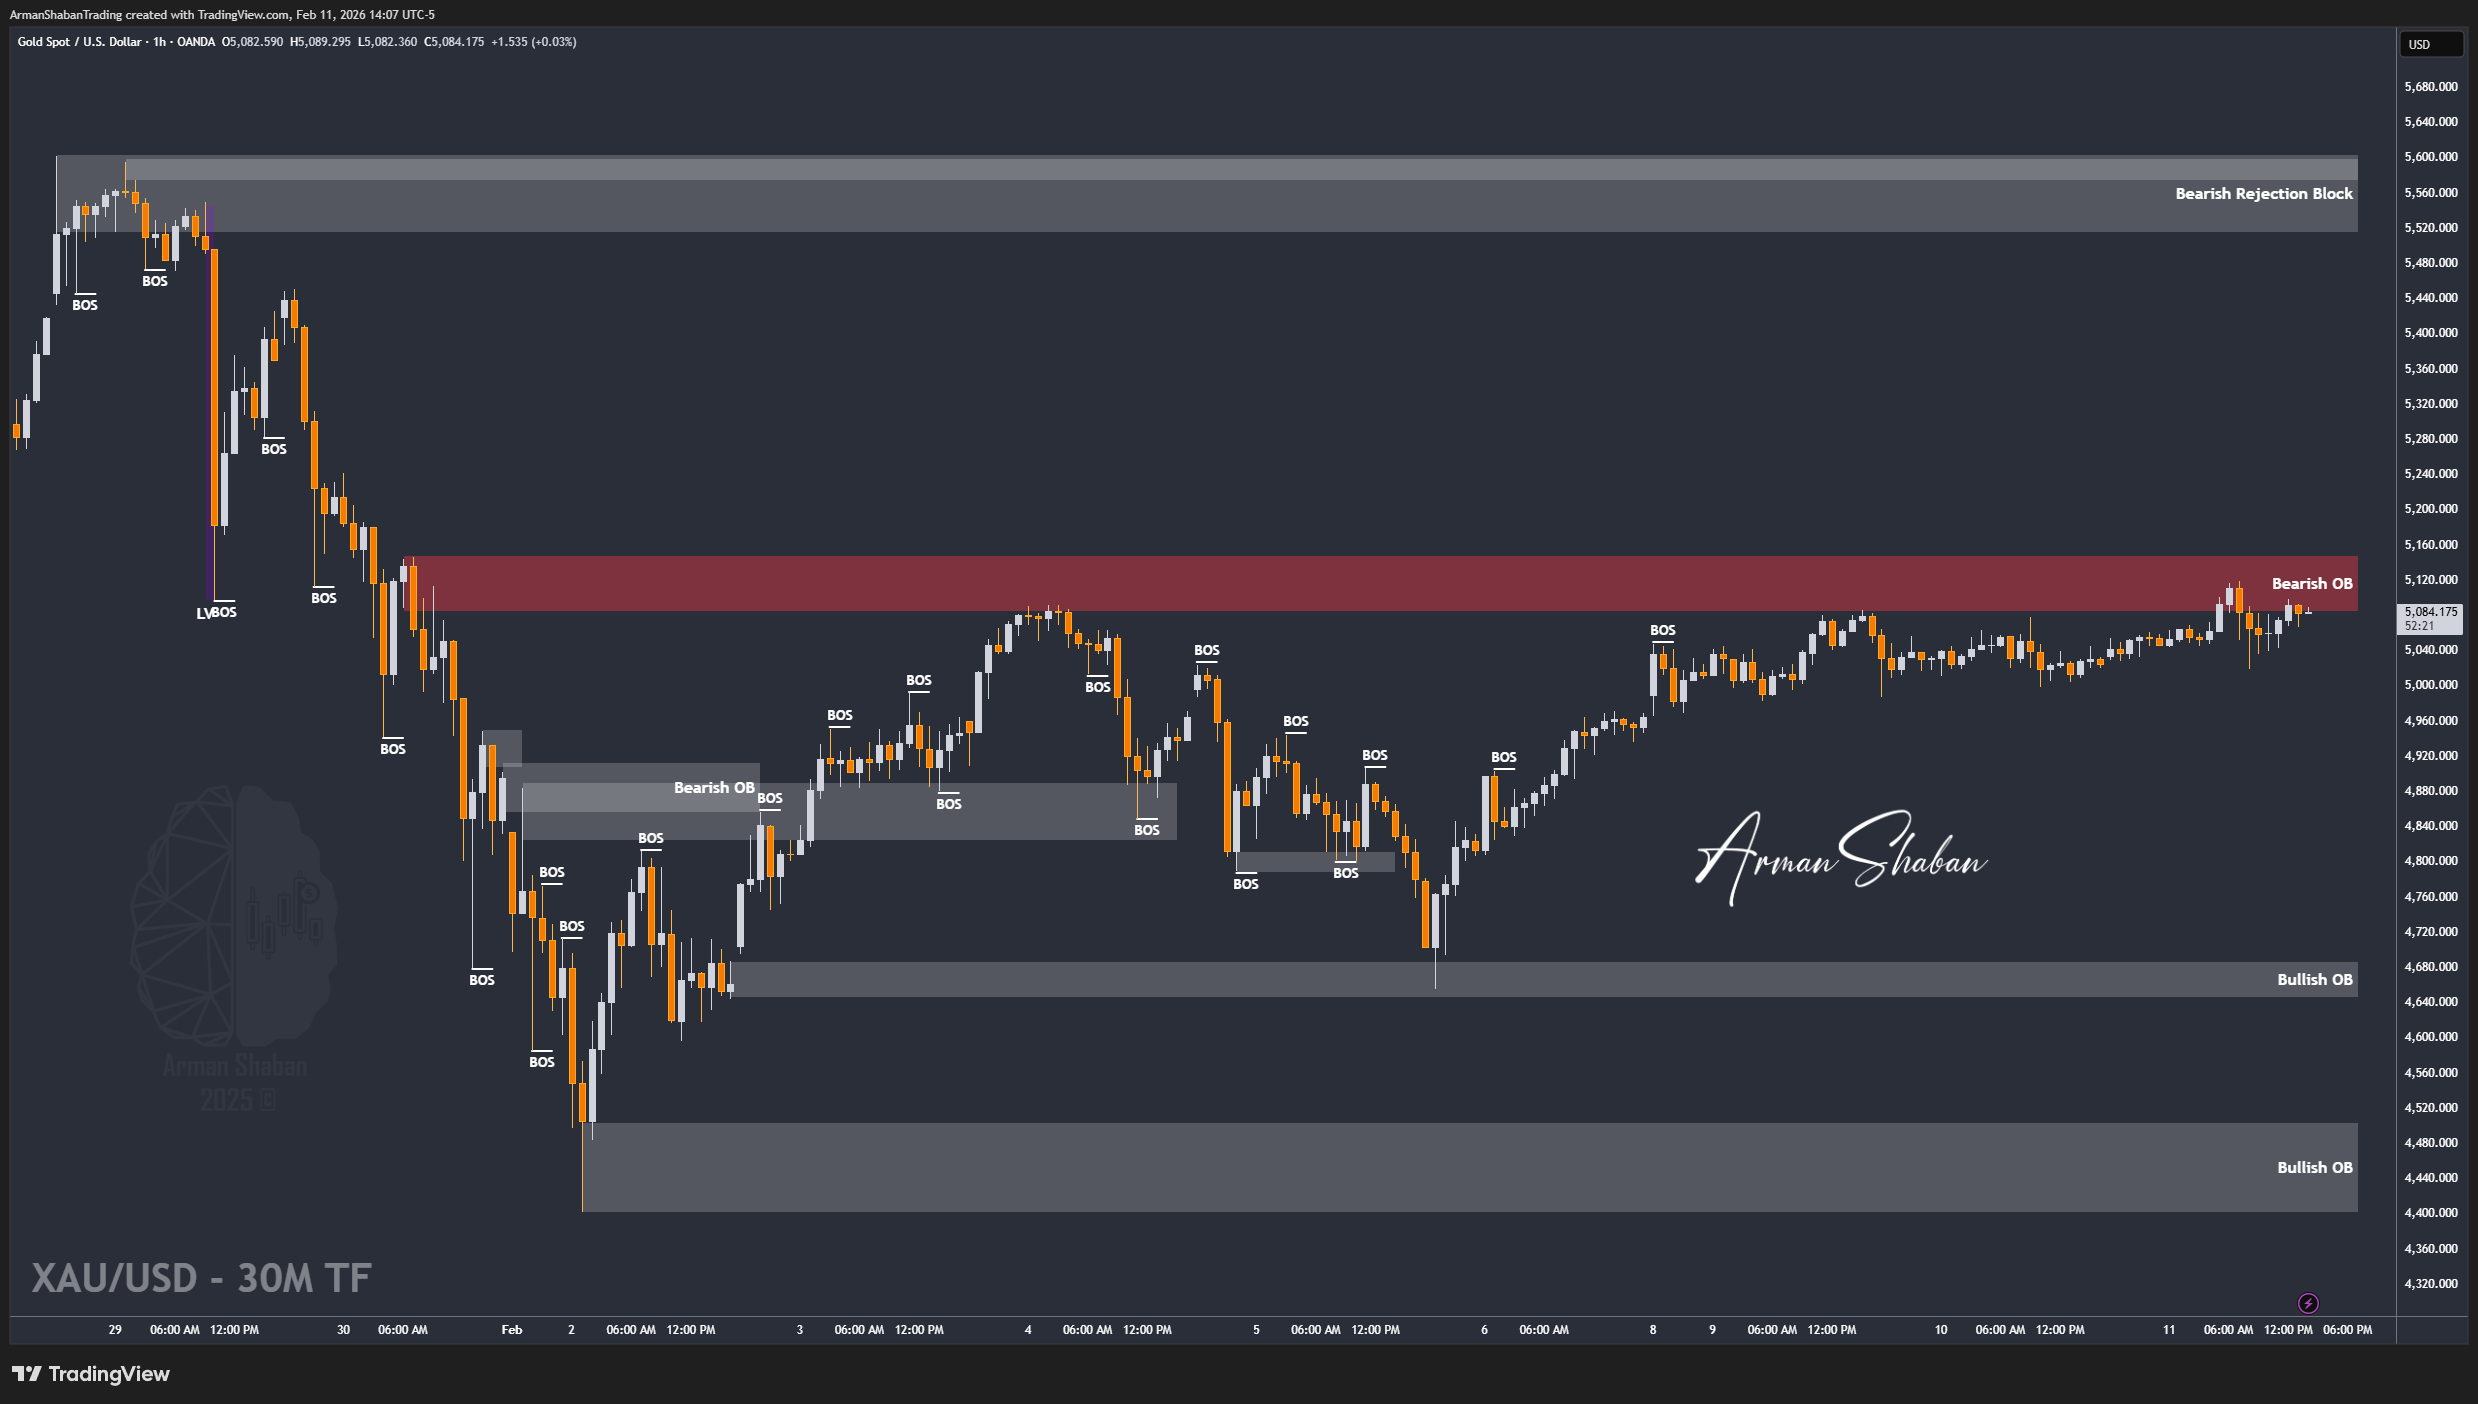
Gold Analysis: By analyzing the #Gold chart on the 1-hour timeframe, we can see that following the NFP release, price sharply dropped toward the $5020 level. However, this move was quickly absorbed by strong demand, and buyers stepped in aggressively.
After this reaction, Gold recovered and is now trading around the $5085 area. The strong bounce from $5020 confirms that demand is still active at lower levels, and momentum is gradually shifting back to the upside.
If price builds strength and maintains this recovery structure, we may soon witness a powerful breakout above the $5120 resistance zone. A confirmed break and hold above this level could open the door for further upside expansion.
Key supply zones remain $5092–$5099 and $5111–$5121.
Keep a close eye on price reaction around $5120. This chart will be updated step by step as price reacts to key levels.
(This Post on TradingView)
Author : Arman Shaban
To see more analyzes of Gold , Forex Pairs , Cryptocurrencies , Indices and Stocks , be sure to Follow and Join us on other Platforms :
– Public Telegram Channel
– YouTube Channel
– TradingView
– X (Twitter)
– How to join our FOREX VIP Channel ?
– How to join our Crypto VIP Channel ?
– CONTACT ME directly on Telegram