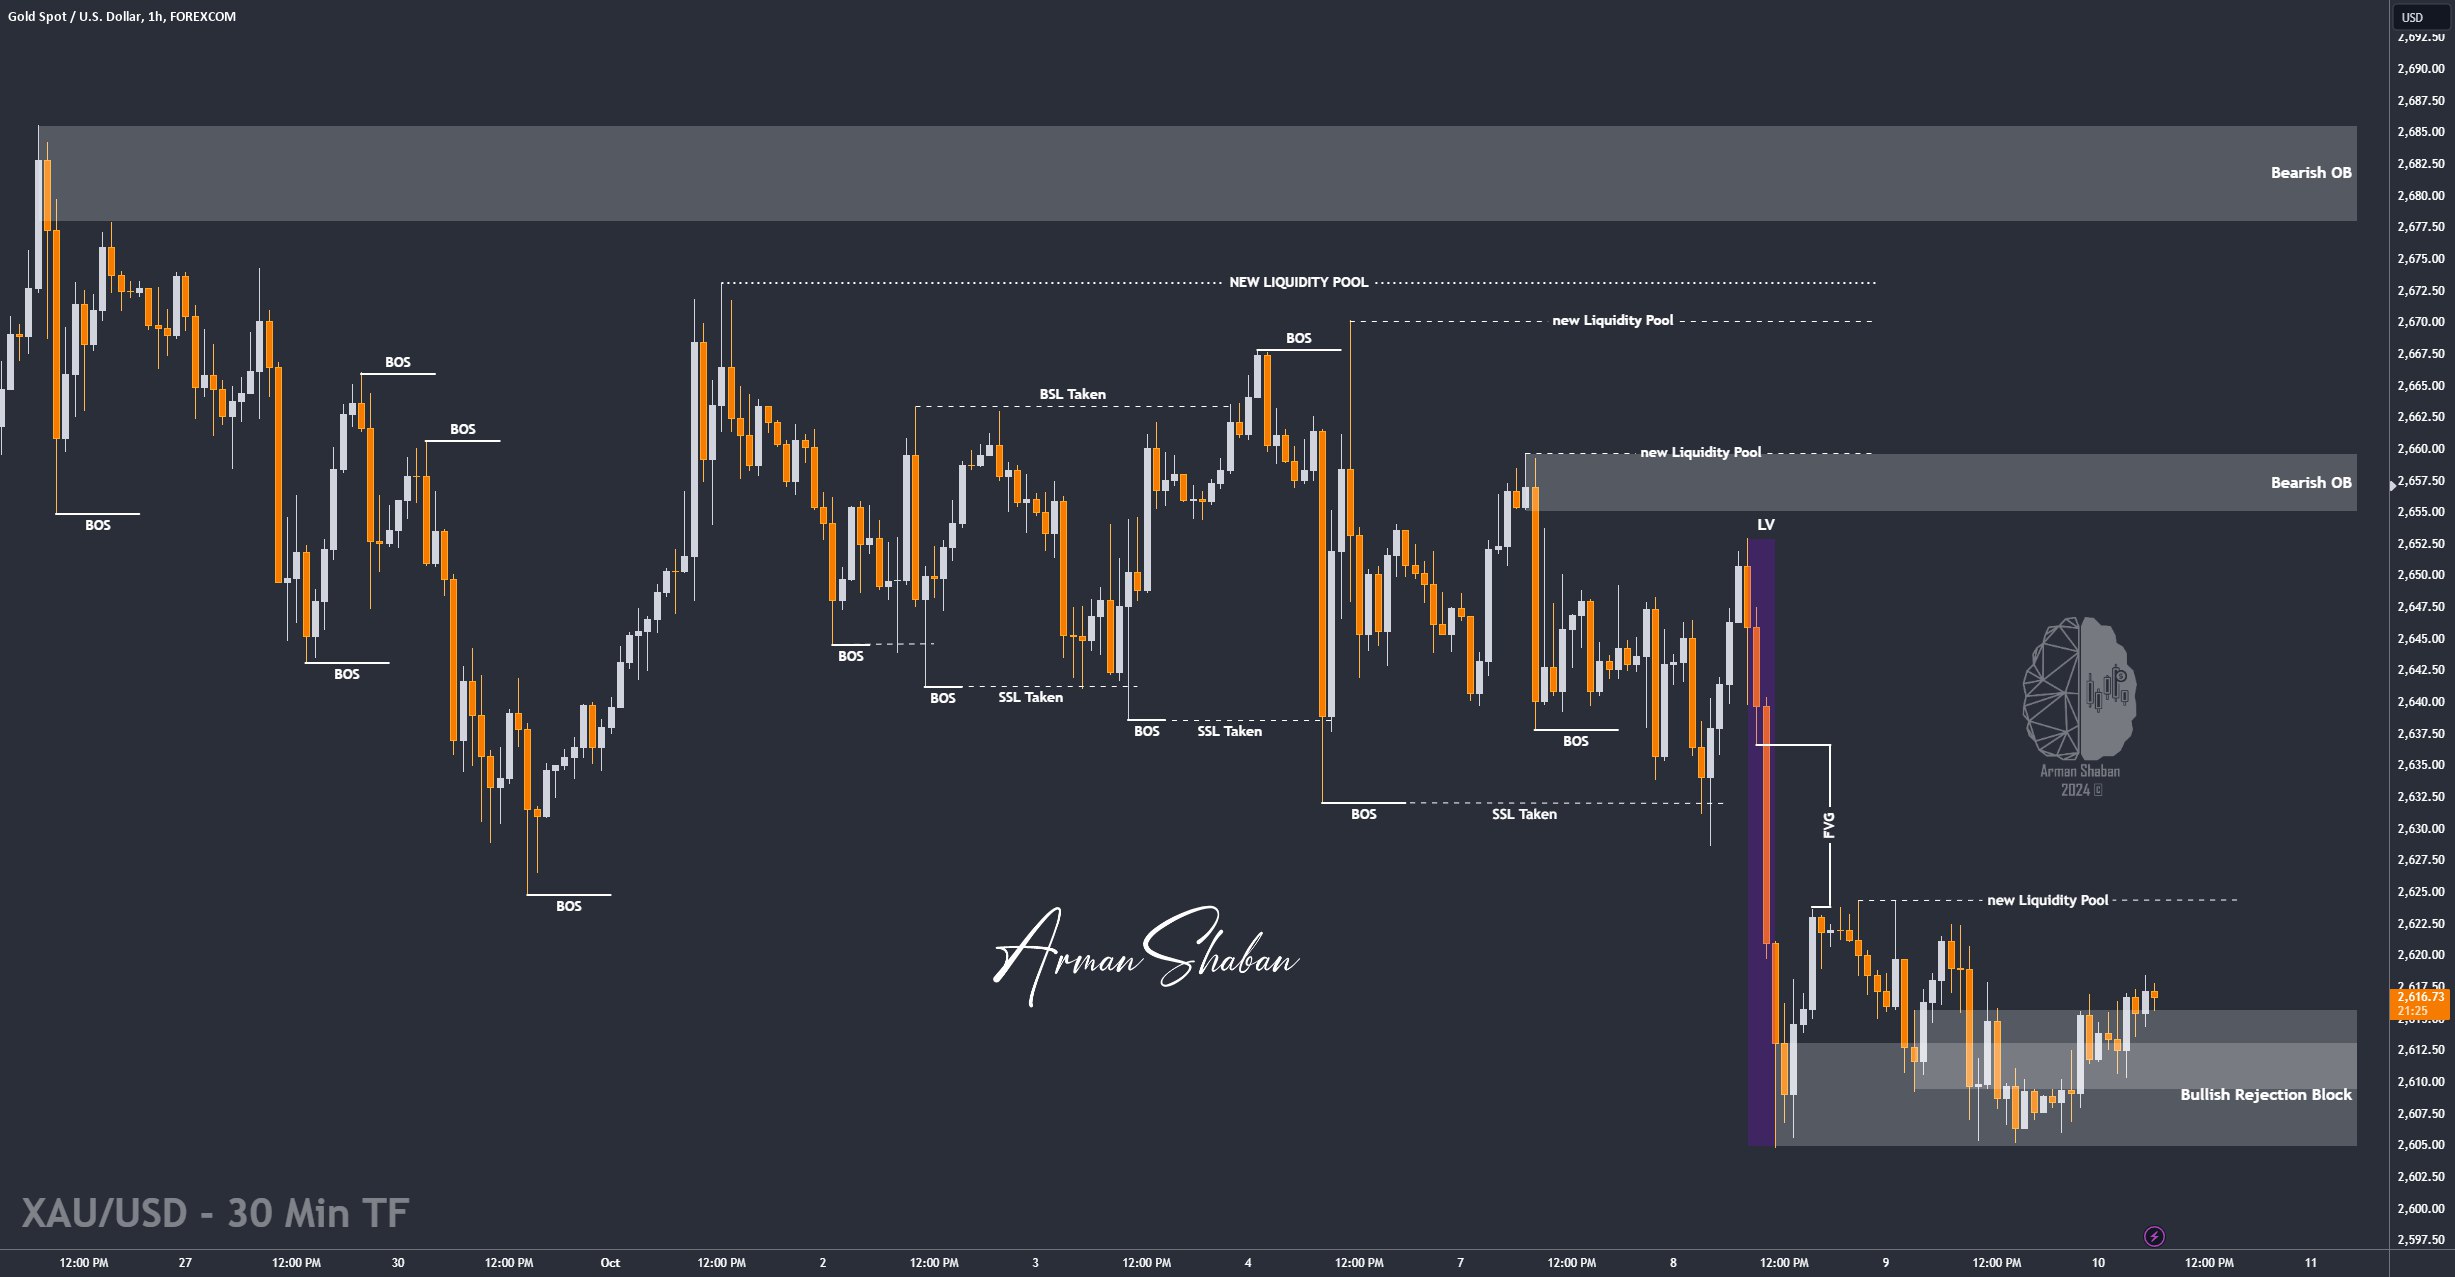
Gold Analysis – 10.Oct.2024

Gold Analysis: By analyzing the Gold chart on the 1-hour timeframe, we can see that after entering the desired demand zone, the price started to rise and is currently trading around $2,617. Considering that the US CPI data will be released today and I expect the actual value to be equal to or lower than the forecasted rate, I anticipate an upward movement in price to fill the liquidity void mentioned in the previous analysis. Based on the previous analysis, the key supply zones remain as follows: $2,625, $2,636.6, $2,646, and $2,655 to $2,660. I hope you make the most out of this analysis!
(This Post on TradingView)
Author : Arman Shaban
To see more analyzes of Gold , Forex Pairs , Cryptocurrencies , Indices and Stocks , be sure to Follow and Join us on other Platforms :
– Public Telegram Channel
– YouTube Channel
– TradingView
– X (Twitter)
– How to join our FOREX VIP Channel ?
– How to join our Crypto VIP Channel ?
– CONTACT ME directly on Telegram