Gold Analysis – 10.Feb.2025
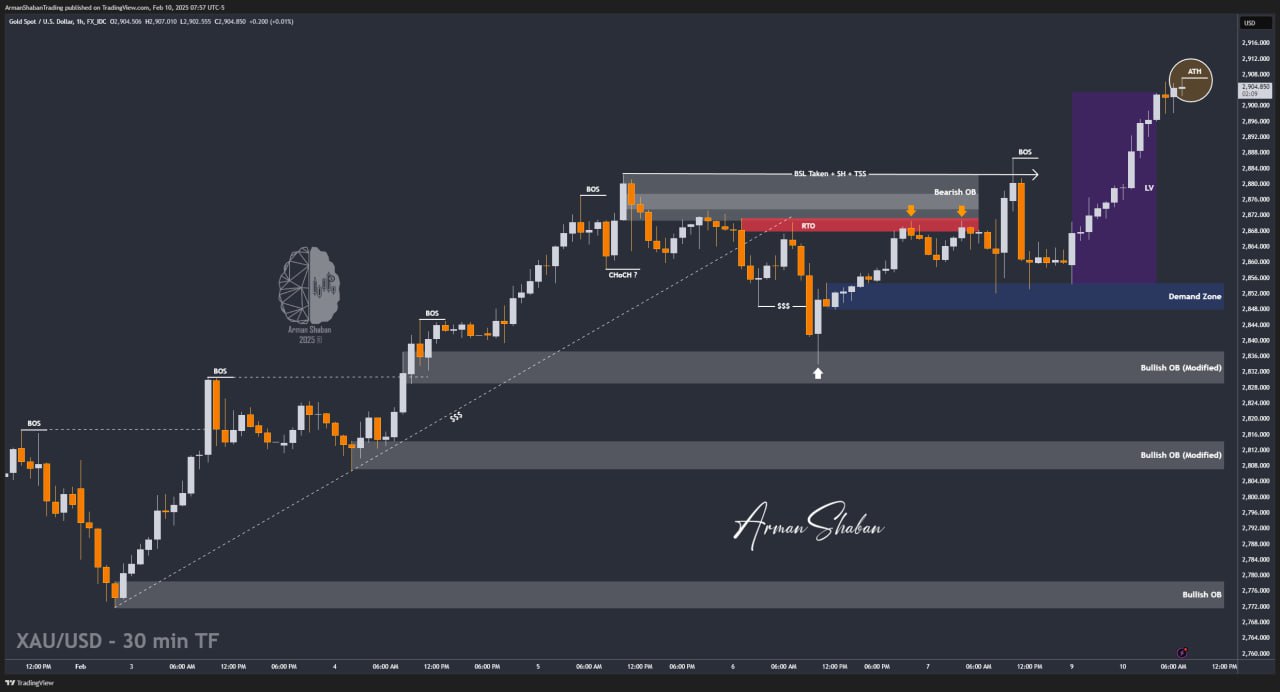
Gold Analysis: By analyzing the 30-minute gold chart, we can see that, as expected from Friday’s analysis, gold started its decline from $2870, correcting down to $2852. After reaching this level, gold rebounded strongly, ultimately setting a new record high at $2907 today! Currently, we observe a Liquidity Void (LV) between $2854 and $2903, which may get filled in the coming weeks or months. However, at this moment, there are no clear signs of a price correction on the chart. As always, to get a high-probability gold analysis, we need to wait for confirmation of a potential correction (which we don’t see yet). This analysis will be updated, and we’ll follow the price action step by step!
(This Post on TradingView)
Author : Arman Shaban
To see more analyzes of Gold , Forex Pairs , Cryptocurrencies , Indices and Stocks , be sure to Follow and Join us on other Platforms :
– Public Telegram Channel
– YouTube Channel
– TradingView
– X (Twitter)
– How to join our FOREX VIP Channel ?
– How to join our Crypto VIP Channel ?
– CONTACT ME directly on Telegram