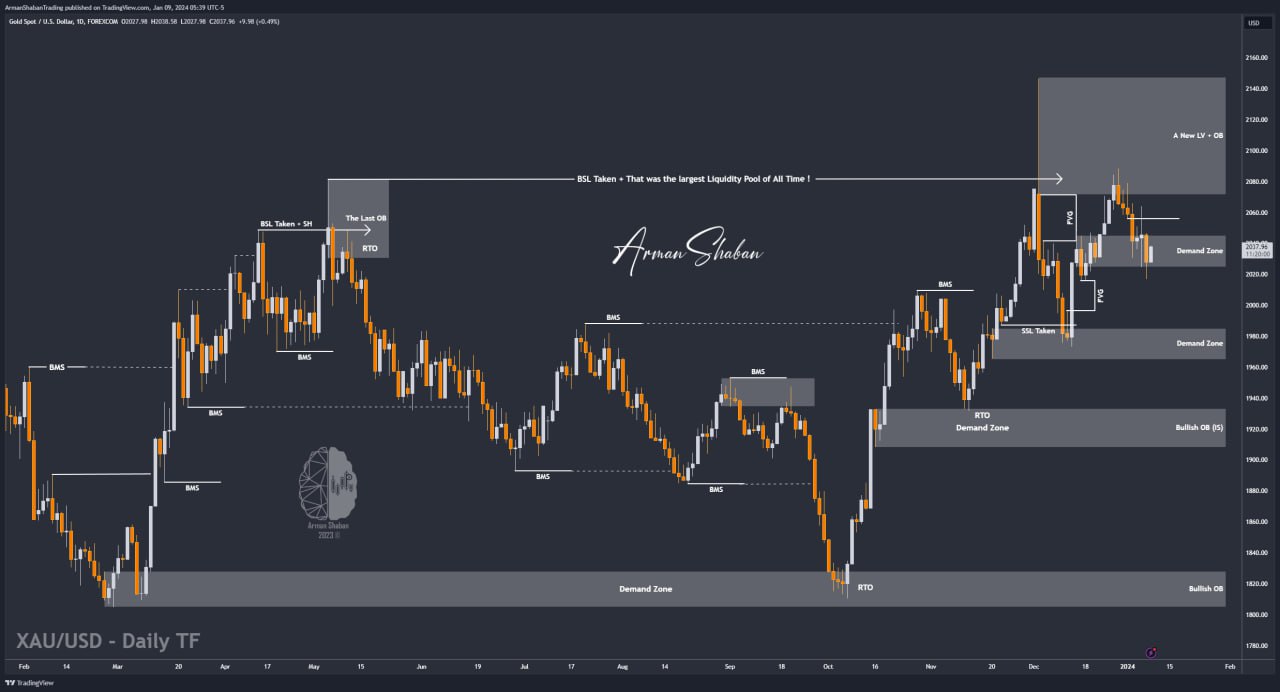
Gold Analysis – 09.Jan.2024

Gold Analysis: By re-examining the gold chart in the daily time frame, we can see that after the price dropped to $2016 yesterday, it was accompanied by demand pressure and has managed to grow up to $2038 so far! Probably this growth will continue until $2043 and then we can expect a reaction to this supply zone ! The main view is still bearish unless proven otherwise, in which case I will share my change of view with you! Still Keep in mind the range of $1997 to $2016!
(This Post on TradingView)
Author : Arman Shaban
– Related Ideas :
– XAU/USD (GOLD) : 08.Jan.2024
– XAU/USD (GOLD) : 07.Jan.2024
– XAU/USD (GOLD) : 05.Jan.2024
– XAU/USD (GOLD) : 04.Jan.2024
– XAU/USD (GOLD) : 03.Jan.2024
To see more analyzes of Gold , Forex Pairs , Cryptocurrencies , Indices and Stocks , be sure to Follow and Join us on other Platforms :
– Public Telegram Channel
– YouTube Channel
– TradingView
– X (Twitter)
– How to join our FOREX VIP Channel ?
– How to join our Crypto VIP Channel ?
– CONTACT ME directly on Telegram