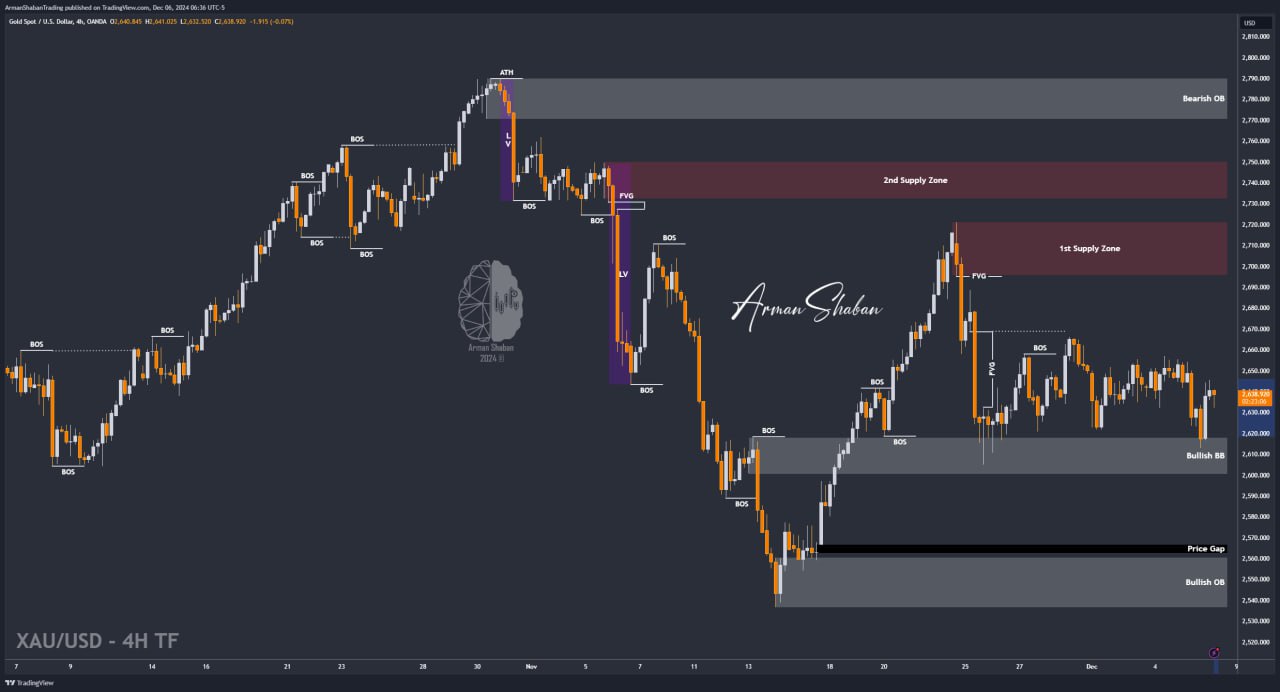
Gold Analysis – 06.Dec.2024

Gold Analysis: Analyzing the #Gold chart in the 4-hour timeframe, we observe that despite all the ups and downs experienced yesterday, the price is still trading around $2638, remaining within the same neutral range of the past 10 days. As you know, today we have the NFP report release. If the report comes out lower than forecast, gold could potentially rise to higher levels. The key resistance zone for gold currently stands between $2645-$2654.
Key Levels to Watch:
📉 Supply Zones (for potential sells): $2660, $2669, $2671, and $2688-$2695
📈 Demand Zones (for potential buys): $2617, $2606, and $2584-$2595
Additionally, observe the impressive price reaction to the $2617 level yesterday on the chart! Upon reaching this level, we witnessed a price surge of over 270 pips.
(This Post on TradingView)
Author : Arman Shaban
To see more analyzes of Gold , Forex Pairs , Cryptocurrencies , Indices and Stocks , be sure to Follow and Join us on other Platforms :
– Public Telegram Channel
– YouTube Channel
– TradingView
– X (Twitter)
– How to join our FOREX VIP Channel ?
– How to join our Crypto VIP Channel ?
– CONTACT ME directly on Telegram