Gold Analysis – 03.Jun.2026
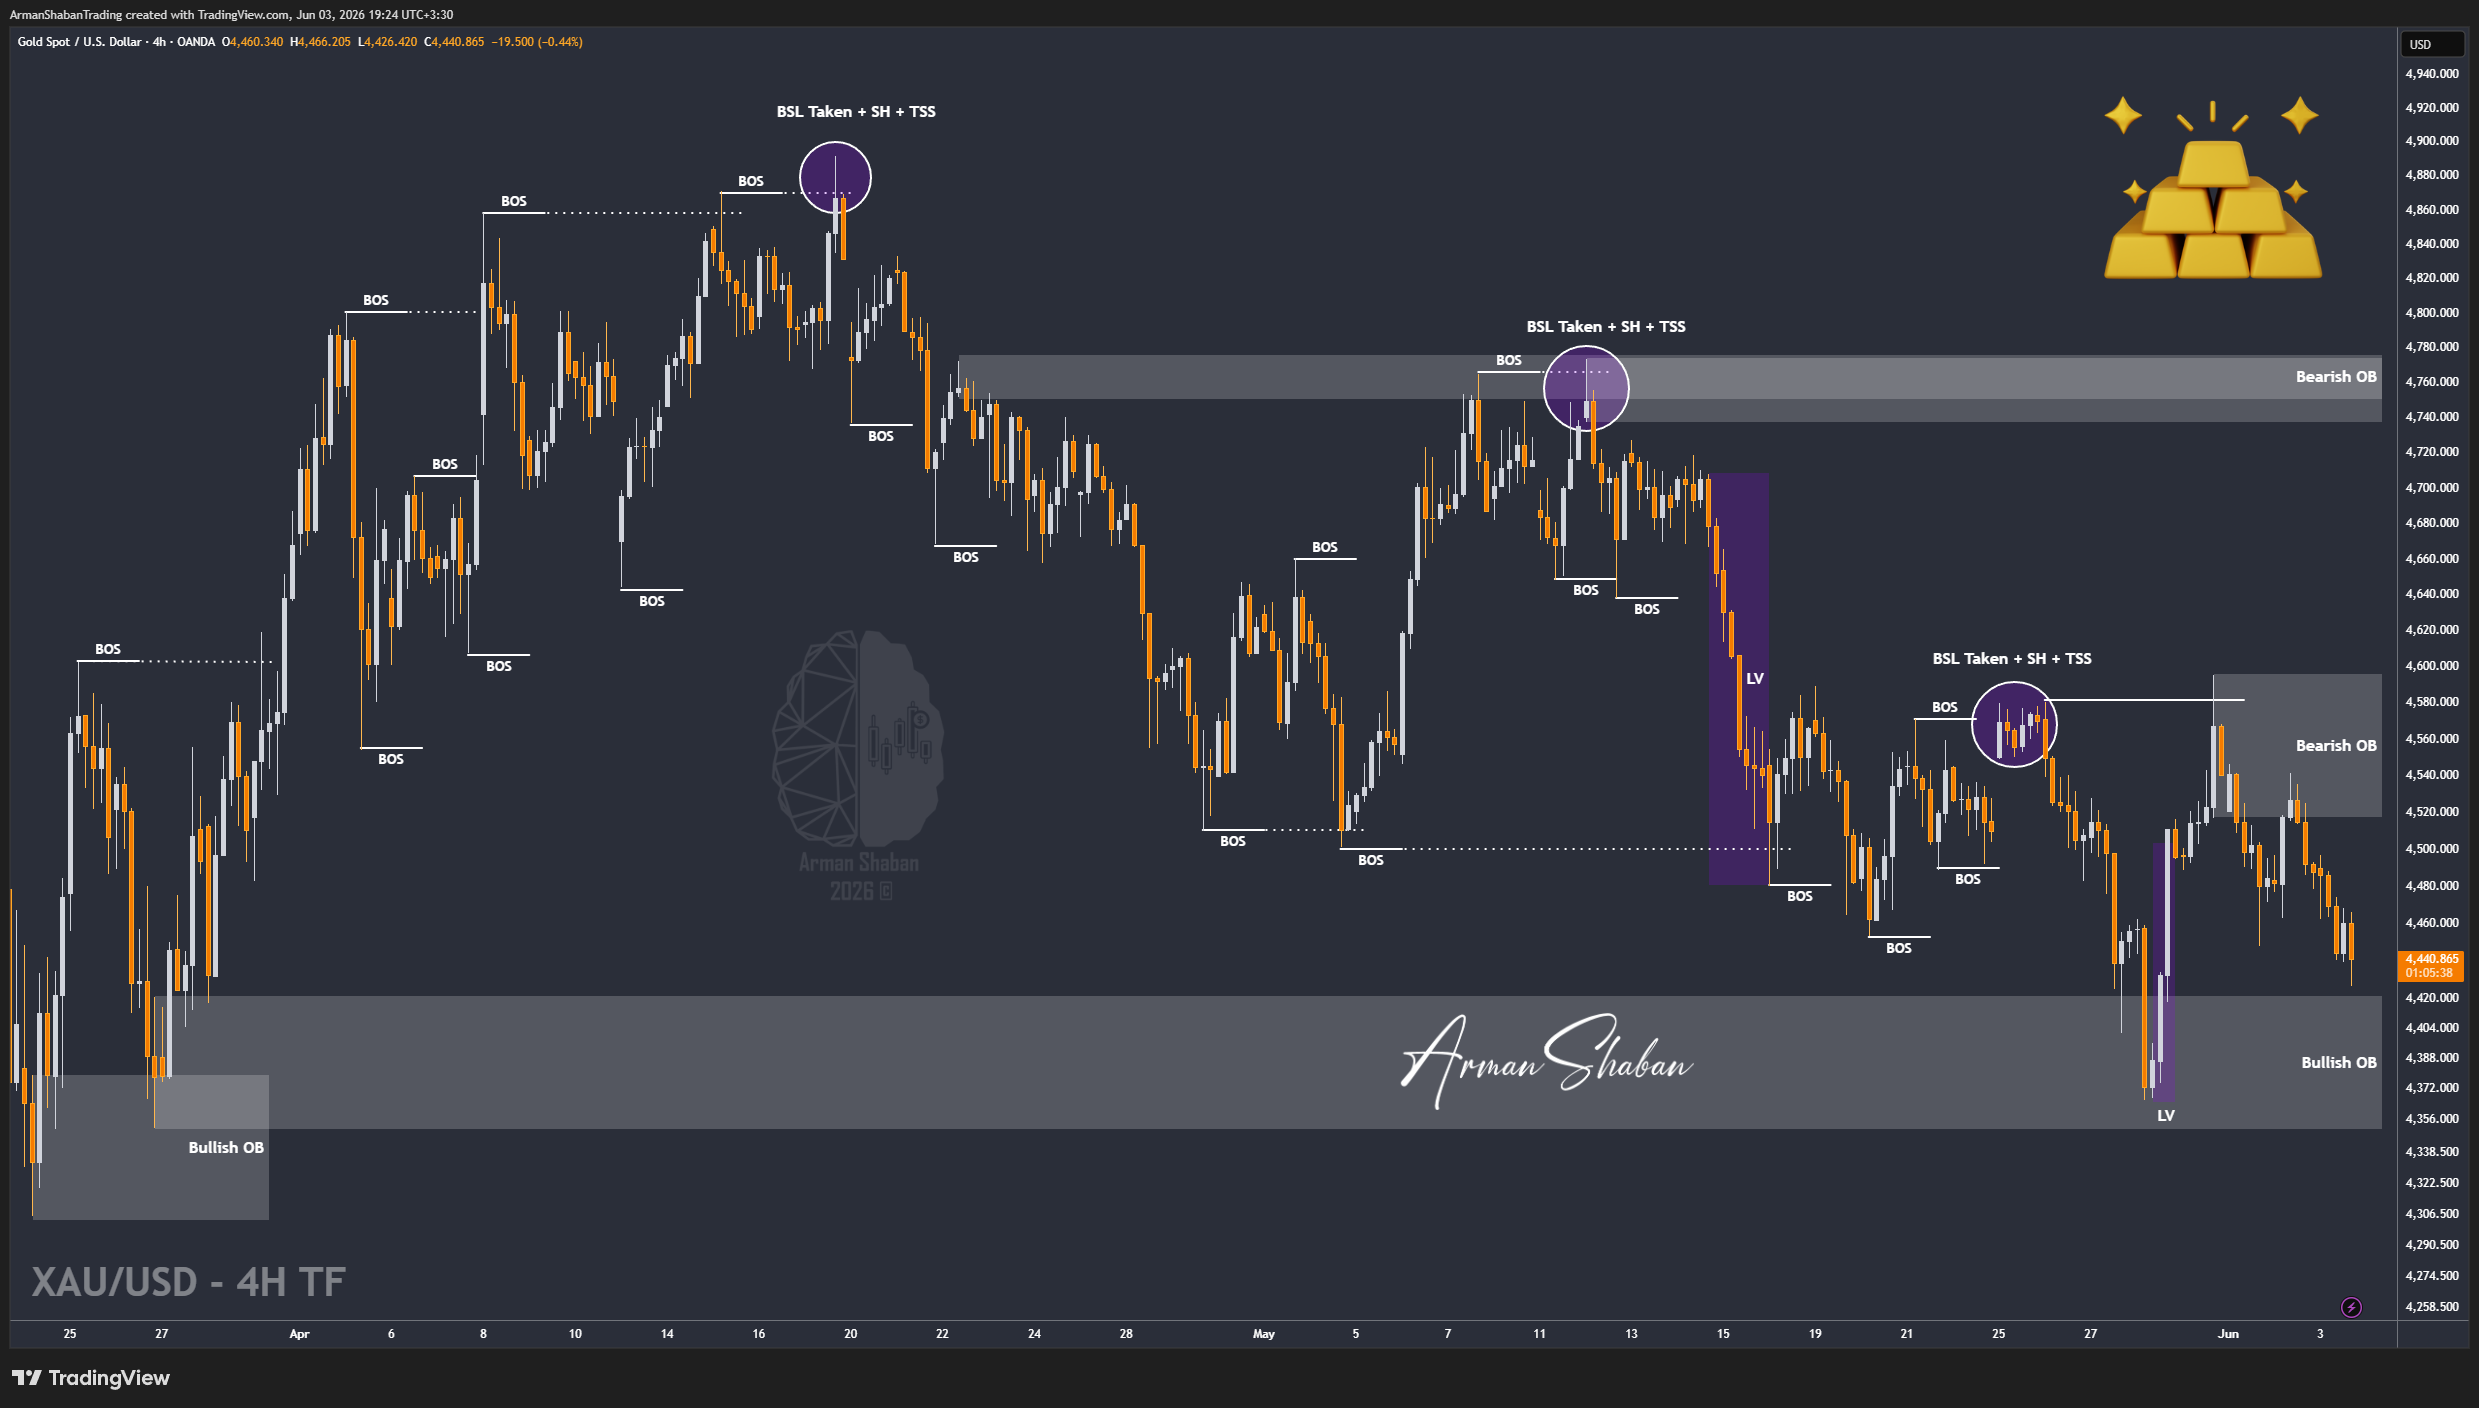
Gold Analysis: By analyzing the #Gold chart on the 4H timeframe, we can see that price once again followed the projected scenario almost perfectly. After rejecting from the discussed supply region, Gold came under renewed selling pressure and extended its decline all the way toward $4428, delivering more than 700 pips of downside movement from the analysis area.
I hope many of you managed to take advantage of this move. Once again, respecting key supply and demand zones proved to be extremely valuable in navigating this volatile market.
Currently, Gold is trading near a major demand region and traders should closely monitor whether buyers can defend this area or if sellers are preparing for another liquidity sweep lower.
From a structural perspective, the nearest demand zones are now located around $4420 – $4440, followed by a deeper demand cluster between $4380 – $4400. On the upside, the closest supply zones are sitting around $4470 – $4490, with a stronger resistance area between $4520 – $4550.
If buyers manage to defend the current demand zone, we could see a short-term recovery toward the nearby supply areas. However, if $4420 fails to hold, the probability of another bearish expansion toward lower liquidity zones increases significantly.
Stay ready… ! A brand-new and powerful Gold analysis is coming soon. Several high-probability ICT setups are currently developing and the next major move could create outstanding trading opportunities. Make sure you don’t miss the next update!
(This Post on TradingView)
Author : Arman Shaban
To see more analyzes of Gold , Forex Pairs , Cryptocurrencies , Indices and Stocks , be sure to Follow and Join us on other Platforms :
– Public Telegram Channel
– YouTube Channel
– TradingView
– X (Twitter)
– How to join our FOREX VIP Channel ?
– How to join our Crypto VIP Channel ?
– CONTACT ME directly on Telegram