Gold Analysis – 03.Dec.2024

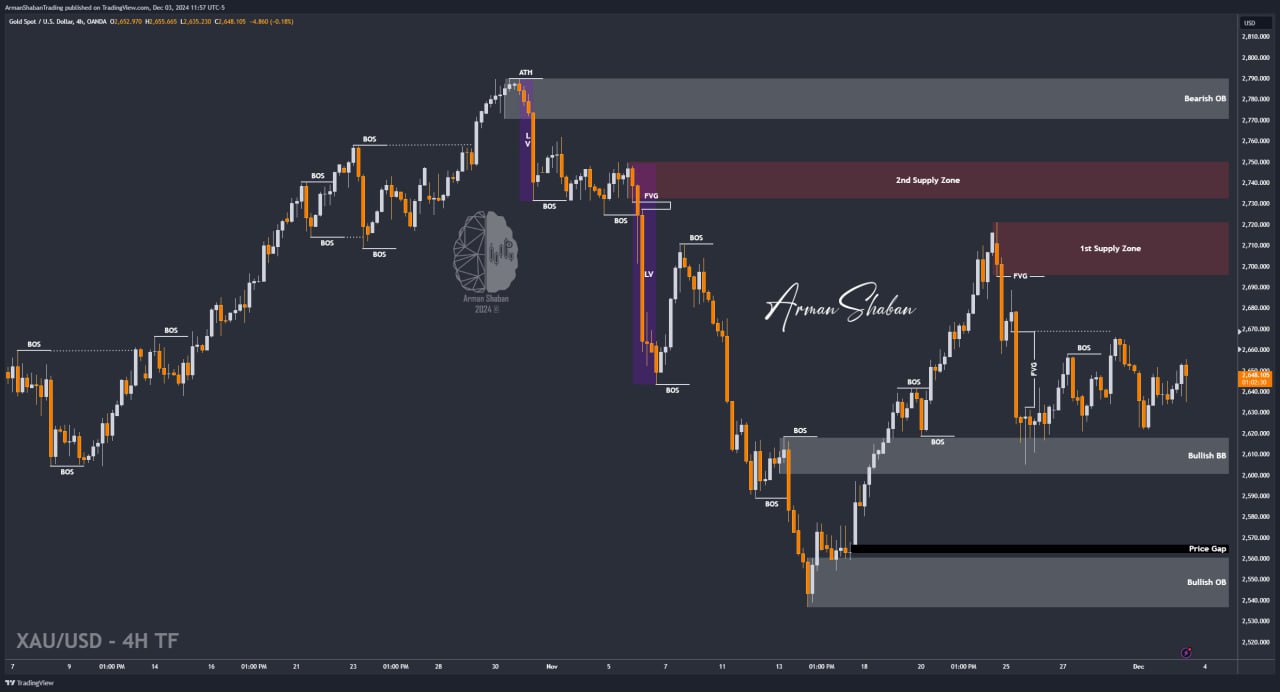
Gold Analysis: Analyzing the gold chart in the 4-hour timeframe, we see that after today’s analysis, the price rose to $2656, followed by a correction. Later, with the release of the JOLTS Job Openings data, gold experienced a further decline, eventually rebounding from the $2635 level. Currently, gold is trading around $2648, with the possibility of further upward movement.
Key Levels to Watch:
📉 Supply Zones (for potential sells): $2660, $2669, $2671, and $2688-$2695
📈 Demand Zones (for potential buys): $2634, $2617, $2606, and $2584-$2595
(This Post on TradingView)
Author : Arman Shaban
To see more analyzes of Gold , Forex Pairs , Cryptocurrencies , Indices and Stocks , be sure to Follow and Join us on other Platforms :
– Public Telegram Channel
– YouTube Channel
– TradingView
– X (Twitter)
– How to join our FOREX VIP Channel ?
– How to join our Crypto VIP Channel ?
– CONTACT ME directly on Telegram