EURUSD : More Bullish ? (19.Nov.2023)
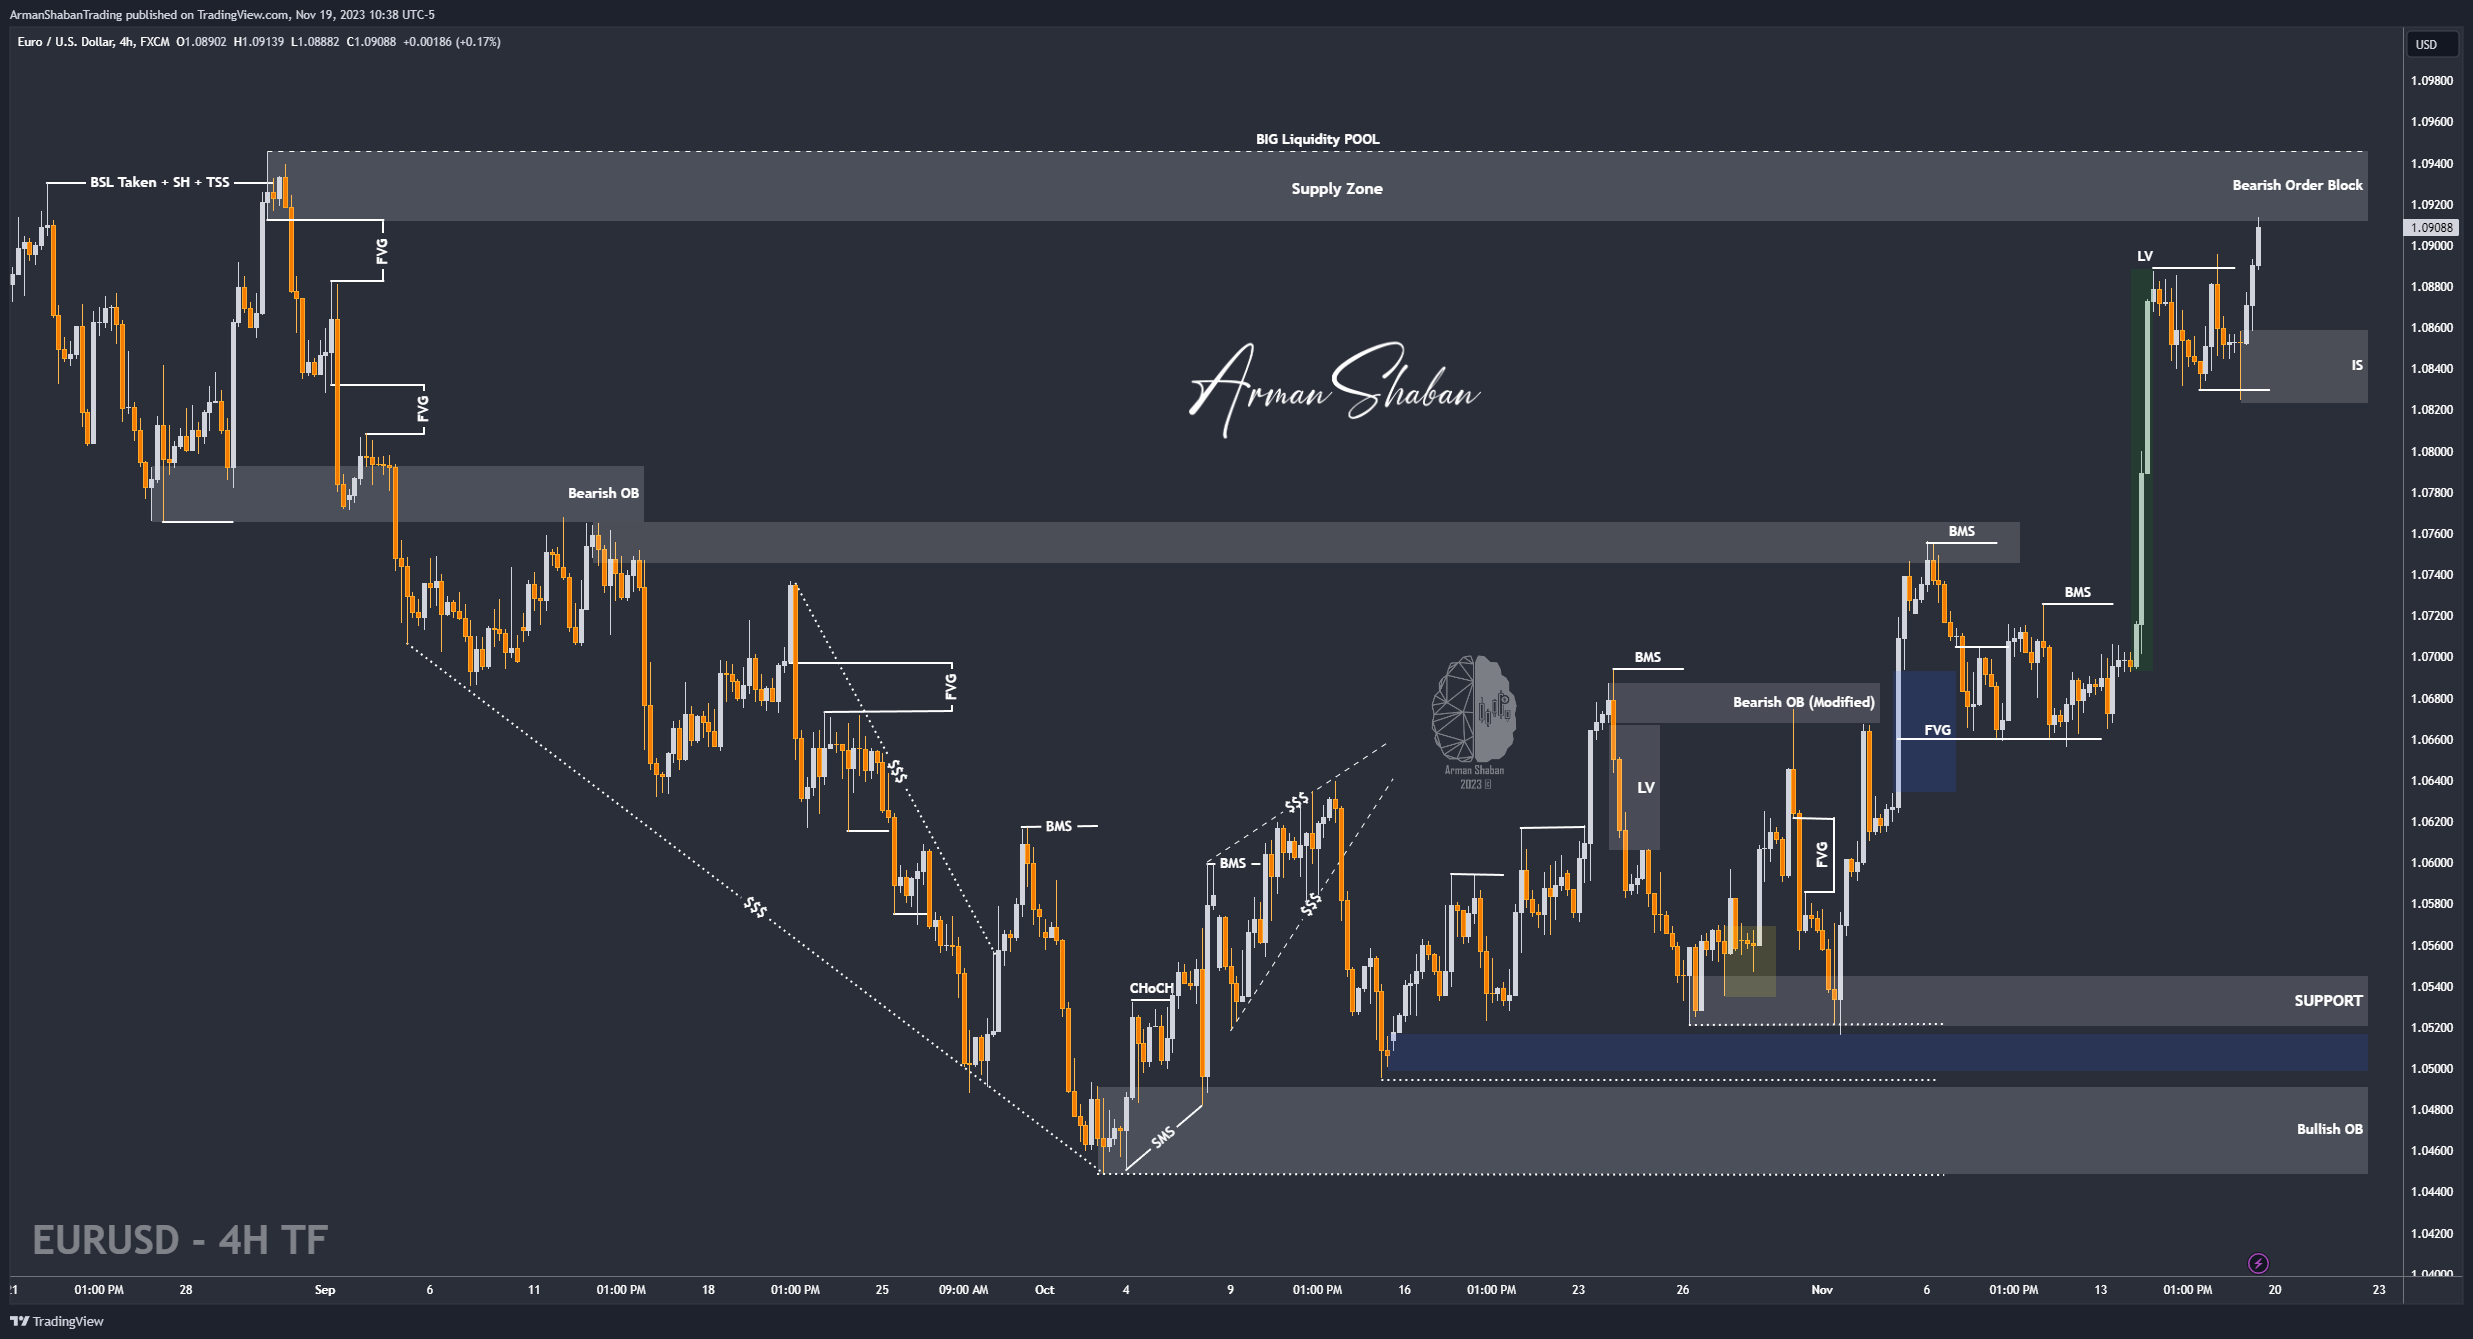
By examining the EURUSD chart, we can see that the price has created a liquidity void (LV) with its growth, which I believe will be filled soon, But before that, I give the possibility that manipulation will happen in the market and then the price will start to correct, which means that considering that the price has reached a supply range, it may move to higher swings again to collect more liquidity And then we will see a heavy price drop!
(this post on tradingview)
Author : Arman Shaban
– Related Ideas :
– EUR/USD : 08.Nov.2023
– EUR/USD : 02.Nov.2023
– EUR/USD : 27.Oct.2023
To see more analyzes of Gold , Forex Pairs , Cryptocurrencies , Indices and Stocks , be sure to Follow and Join us on other Platforms :
– Public Telegram Channel
– YouTube Channel
– TradingView
– X (Twitter)
– How to join our FOREX VIP Channel ?
– How to join our Crypto VIP Channel ?
– CONTACT ME directly on Telegram
11 Responses
[…] Gold Analysis: As you can see, based on the latest gold price analysis, we saw that the price, as we expected, was accompanied by a further drop and was able to correct until $2009! In the last 2 days, we saw the price rise to $2149 and then a heavy drop of 1373 pips to the range of $2009! Based on the assumptions of the previous analysis, we expected that if this FALL continues, we will see the price reach $1993 as the first bearish target! As long as the price trades below the specified FVG range, we still expect gold to fall further, but note that there is a liquidity gap in the range of $2040 to $2072, which I expect to be filled in the short term and after If we witness the stabilization of the price below this range, we can expect the price to drop to lower prices such as $1993 and $1939!(This Post on TradingView) […]
[…] Bitcoin Analysis: With the new analysis of the Bitcoin chart in the weekly time frame, we see that the price, based on the analysis we had, finally managed to hit the target of $44,000 and even managed to record the price of $45,000! Based on my view on the chart, I have determined the important levels of supply, demand, possible targets, etc. that we will address! Currently, the price has reached the supply range of $44,290 to $48,300, as you can see, the initial reaction to this range was corrective! The first support in front of the price range is $35,630 to $38,430. If the price corrects to this range, we will expect an increase in demand! The next possible upward targets are $48,560 and $53,210, respectively, if the desired support is maintained, note that the price level of $53,210 is an important supply level that you can consider for the SELL position! The next mid-term targets are $57,700 and $62,300 respectively! If we want to look a bit more optimistic and long-term, the target of $77,000 will not be far from expectations! Note that this analysis was done in the weekly time frame!(This Post on TradingView) […]
[…] Gold Analysis: By examining gold in the weekly time frame, we see that the price is still below the range that we have determined based on the latest analysis, and until the price can be stabilized below $2072, our bearish view is still valid! The overall yield of this analysis has been more than 600 pips so far and we have to see if the price can penetrate below $2000 by the end of the week! (more details in the next analysis in the daily time frame)(This Post on TradingView) […]
[…] Gold Analysis: With a more detailed examination of the price in the daily time frame, we can see that after the price was able to fall to $2009, it was accompanied by demand and up to this moment it was able to grow up to $2035! Also, the range of FVG is $2040 to $2072 in front of the price, which is likely to be filled in the short term! Then, if the price succeeds in stabilizing below $2072, we can expect another price drop, the possible targets of which will be below the $2000 level! This analysis will be updated!(This Post on TradingView) […]
[…] Gold Analysis: After the desired position was closed based on this analysis at the price of $2025, we saw that the price fluctuated in both upward and downward directions and is currently trading in the range of $2028, if the price to fill FVG goes to the range of $2040 to $2072, after that we can look for a trigger for a SELL position in the two ranges of $2040 to $2044 and $2070 to $2072! If this price decline continues, gold can correct to lower targets such as $1999, $1993 and $1986! These explanations are complementary to the original analysis and make sure you read the original analysis!(This Post on TradingView) […]
[…] Gold Analysis: By analyzing the gold chart in the weekly time frame, we see that the price was able to penetrate below $2000 in the past week and finally close at the price of 2004.440 ! The yield of the main analysis has been more than 750 pips, and considering that we are in a week full of important news, I will expect a lot of price fluctuations! The important supply zones are $2034 to $2038, $2044 to $2046 and $2071 respectively, and the important demand zones are $1992 to $1994, $1964 to $1966 and $1939 respectively! Still, the main view on this chart is bearish! (more details in the next analysis in the daily time frame)(This Post on TradingView) […]
[…] Gold Analysis: By examining gold in the daily time frame, we see that the price has progressed according to the first scenario and as you can see, it is currently trading in the range of $1996. If today’s price loses the support of the $1987 to $2006 range, we may see a drop to lower targets such as $1986, $1980, and $1966! Important Question : Do you think gold can fall below $1900 this week? This is an important question and I ask you to share your opinion with me through the link below and support the analysis with your like guys , Thanks !(This Post on TradingView) […]
[…] Ideas :– EUR/USD : 19.Nov.2023– EUR/USD : 08.Nov.2023– EUR/USD : 02.Nov.2023– EUR/USD : 27.Oct.2023To see more analyzes […]
[…] Ideas :– EUR/USD : 18.ِDec.2023– EUR/USD : 11.ِDec.2023– EUR/USD : 19.Nov.2023– EUR/USD : 08.Nov.2023– EUR/USD : 02.Nov.2023To see more analyzes of Gold , Forex Pairs , […]
[…] Bitcoin Analysis: By checking the Bitcoin chart in the 2-hour time frame, we can see that the price is trading in the range of $43,600 and if the price cannot penetrate above $44,700 again, we will see a further drop in the price! Important demand ranges are $42,700 to $43,000 and $40,200 to $40,700 respectively! The supply ranges are $43,900 to $44,400 and $45,500 respectively!(This Post on TradingView) […]
[…] Bitcoin Analysis: As you can see, the price started to correct from the range we specified and with more than 3.5% drop, it reached $42150! As you can see on the chart, the price is currently in a demand range, because of this, it has reacted positively to this level twice! We have to see if Bitcoin penetrates below $41800 or not! Other assumptions of the previous analysis are still valid!(This Post on TradingView) […]