Gold Analysis – 27.Jul.2026
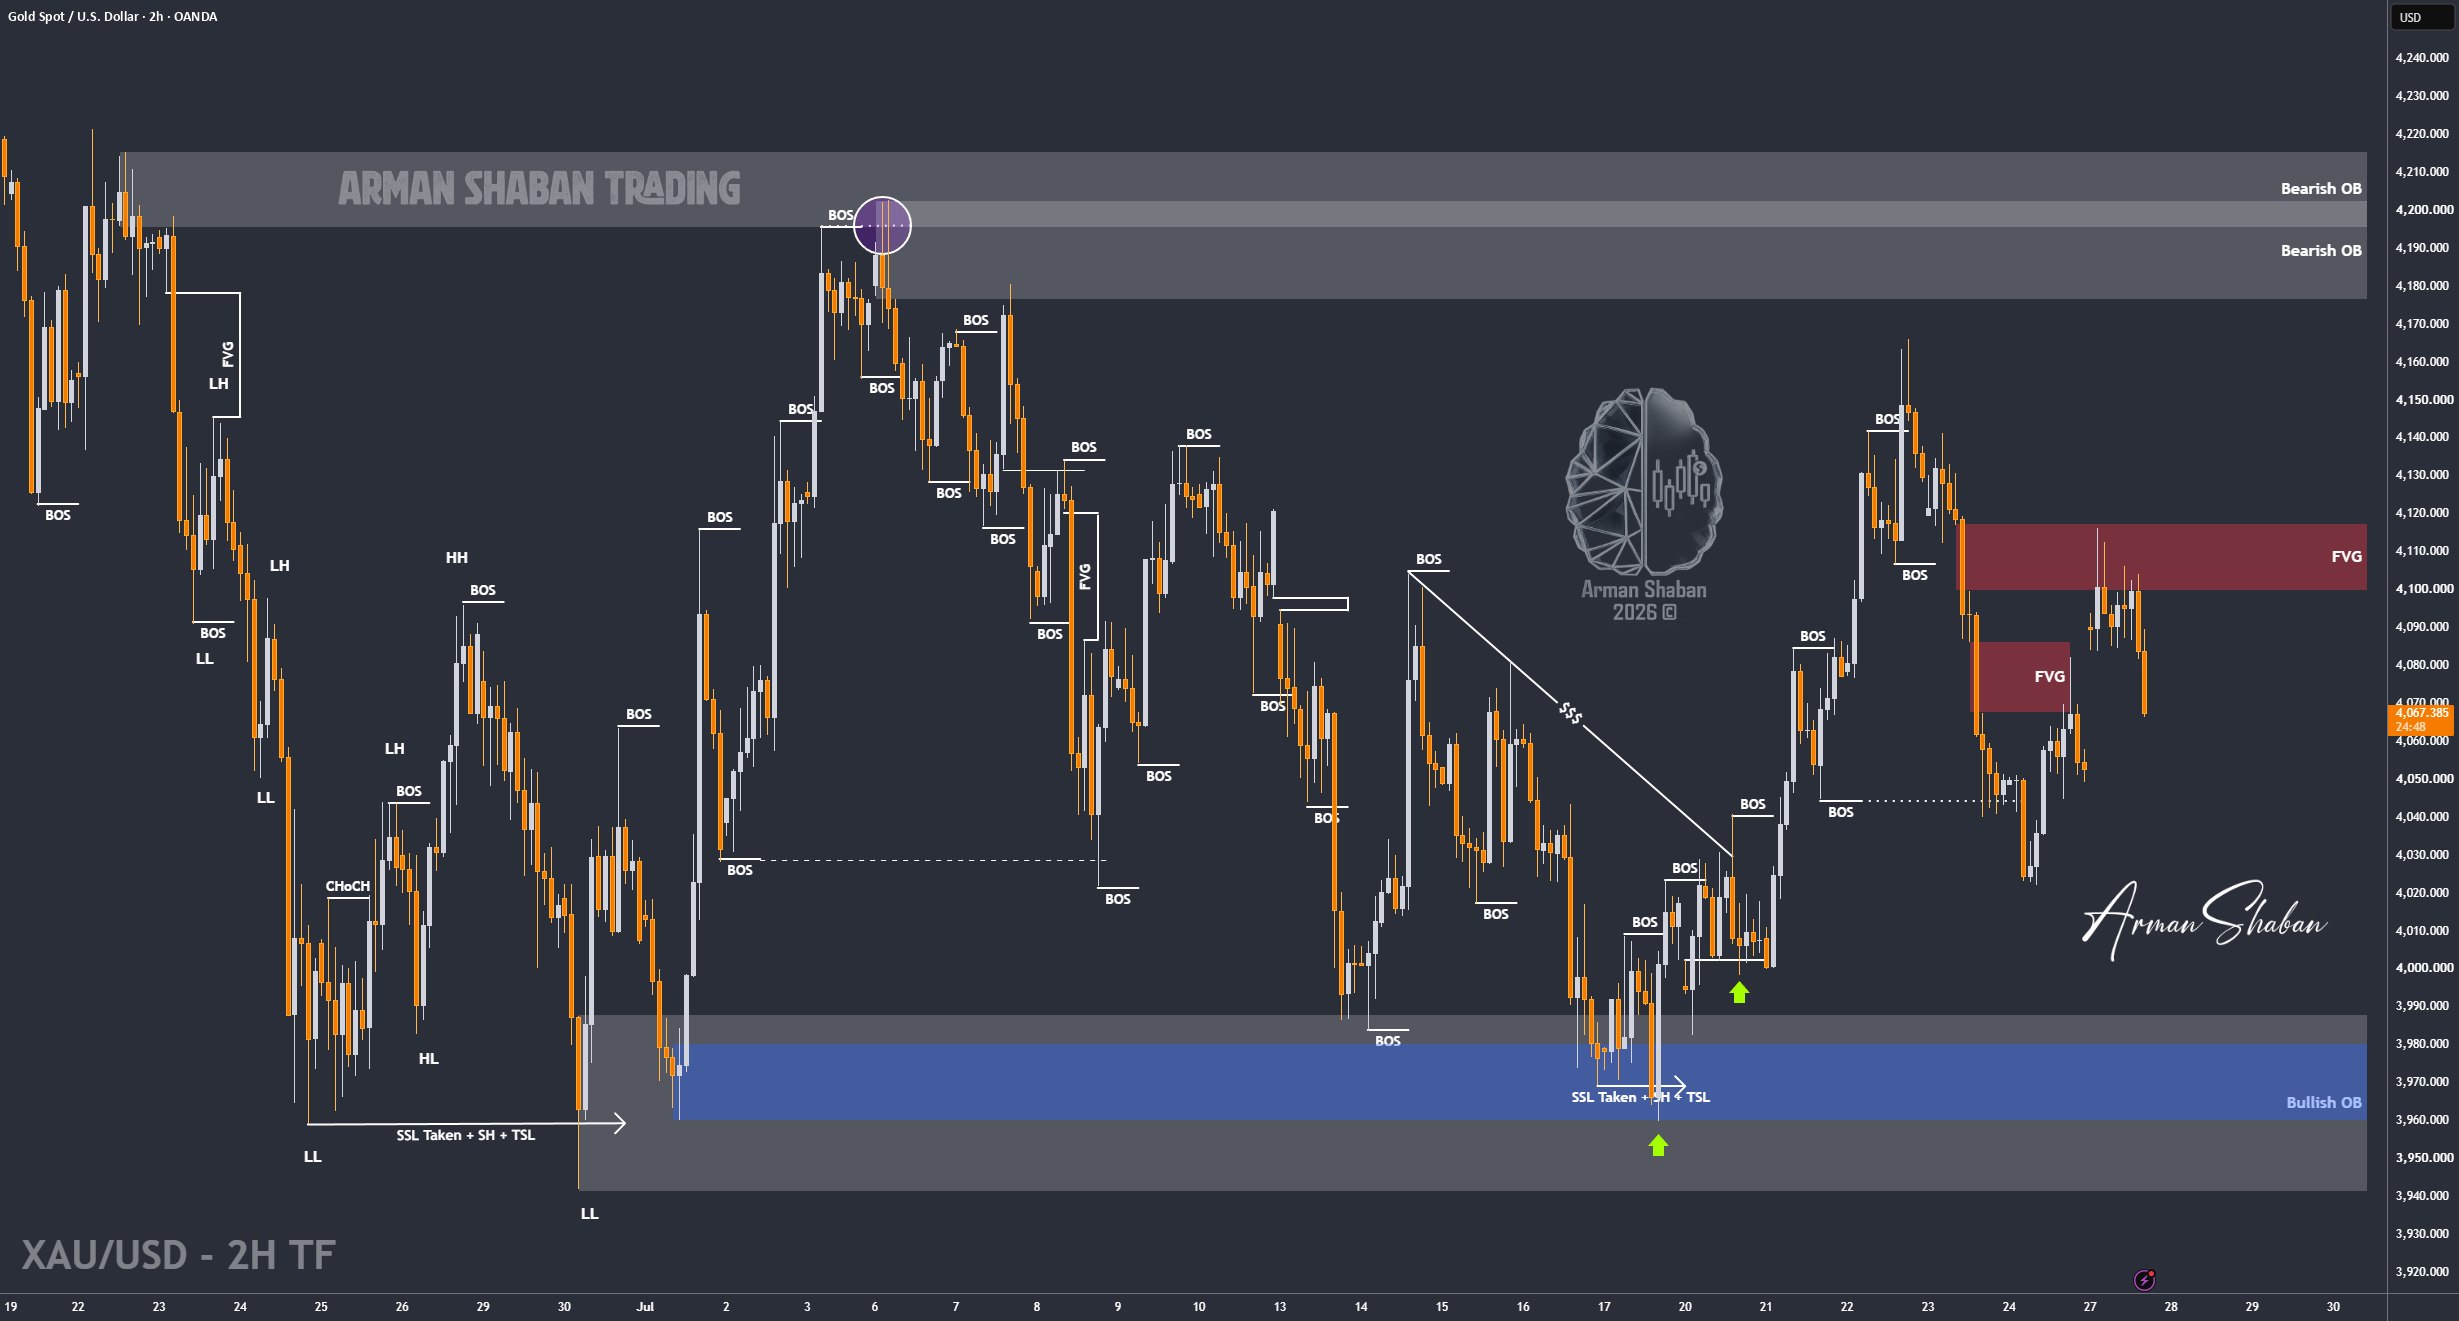
Gold Analysis: By analyzing the #Gold chart on the 2H timeframe, we can see that after the previous analysis, price first filled the initial FVG and then dropped toward $4049, eventually closing the week around $4052.
At the beginning of the new week, Gold opened with a large bullish gap around $4090 and extended its rally toward $4116. This move also completely filled the second FVG marked on the chart.
After completing this imbalance, sellers stepped in and price entered another corrective move. Gold is currently trading around $4073.
In my view, Gold could continue lower toward at least the $4050 region in order to fully fill the newly created weekly gap. The nearest supply area is located around $4090 – $4116, while the key demand areas to monitor are around $4045 – $4055, followed by $4015 – $4030.
My bias for this week remains bearish, which is currently against the broader market sentiment. Many traders believe that tensions between Iran and the United States have eased and that another period of peace has begun.
Personally, I believe these developments may only be temporary and mainly delay the next escalation. If geopolitical tensions increase again, Gold could enter another bearish phase under the current market structure.
For now, the first target remains the complete gap fill around $4050. After that, we will monitor the reaction from buyers and sellers before confirming the next move.
(This Post on TradingView)
Author : Arman Shaban
To see more analyzes of Gold , Forex Pairs , Cryptocurrencies , Indices and Stocks , be sure to Follow and Join us on other Platforms :
– Public Telegram Channel
– YouTube Channel
– TradingView
– X (Twitter)
– How to join our FOREX VIP Channel ?
– How to join our Crypto VIP Channel ?
– CONTACT ME directly on Telegram

