Gold Analysis – 10.Jul.2026
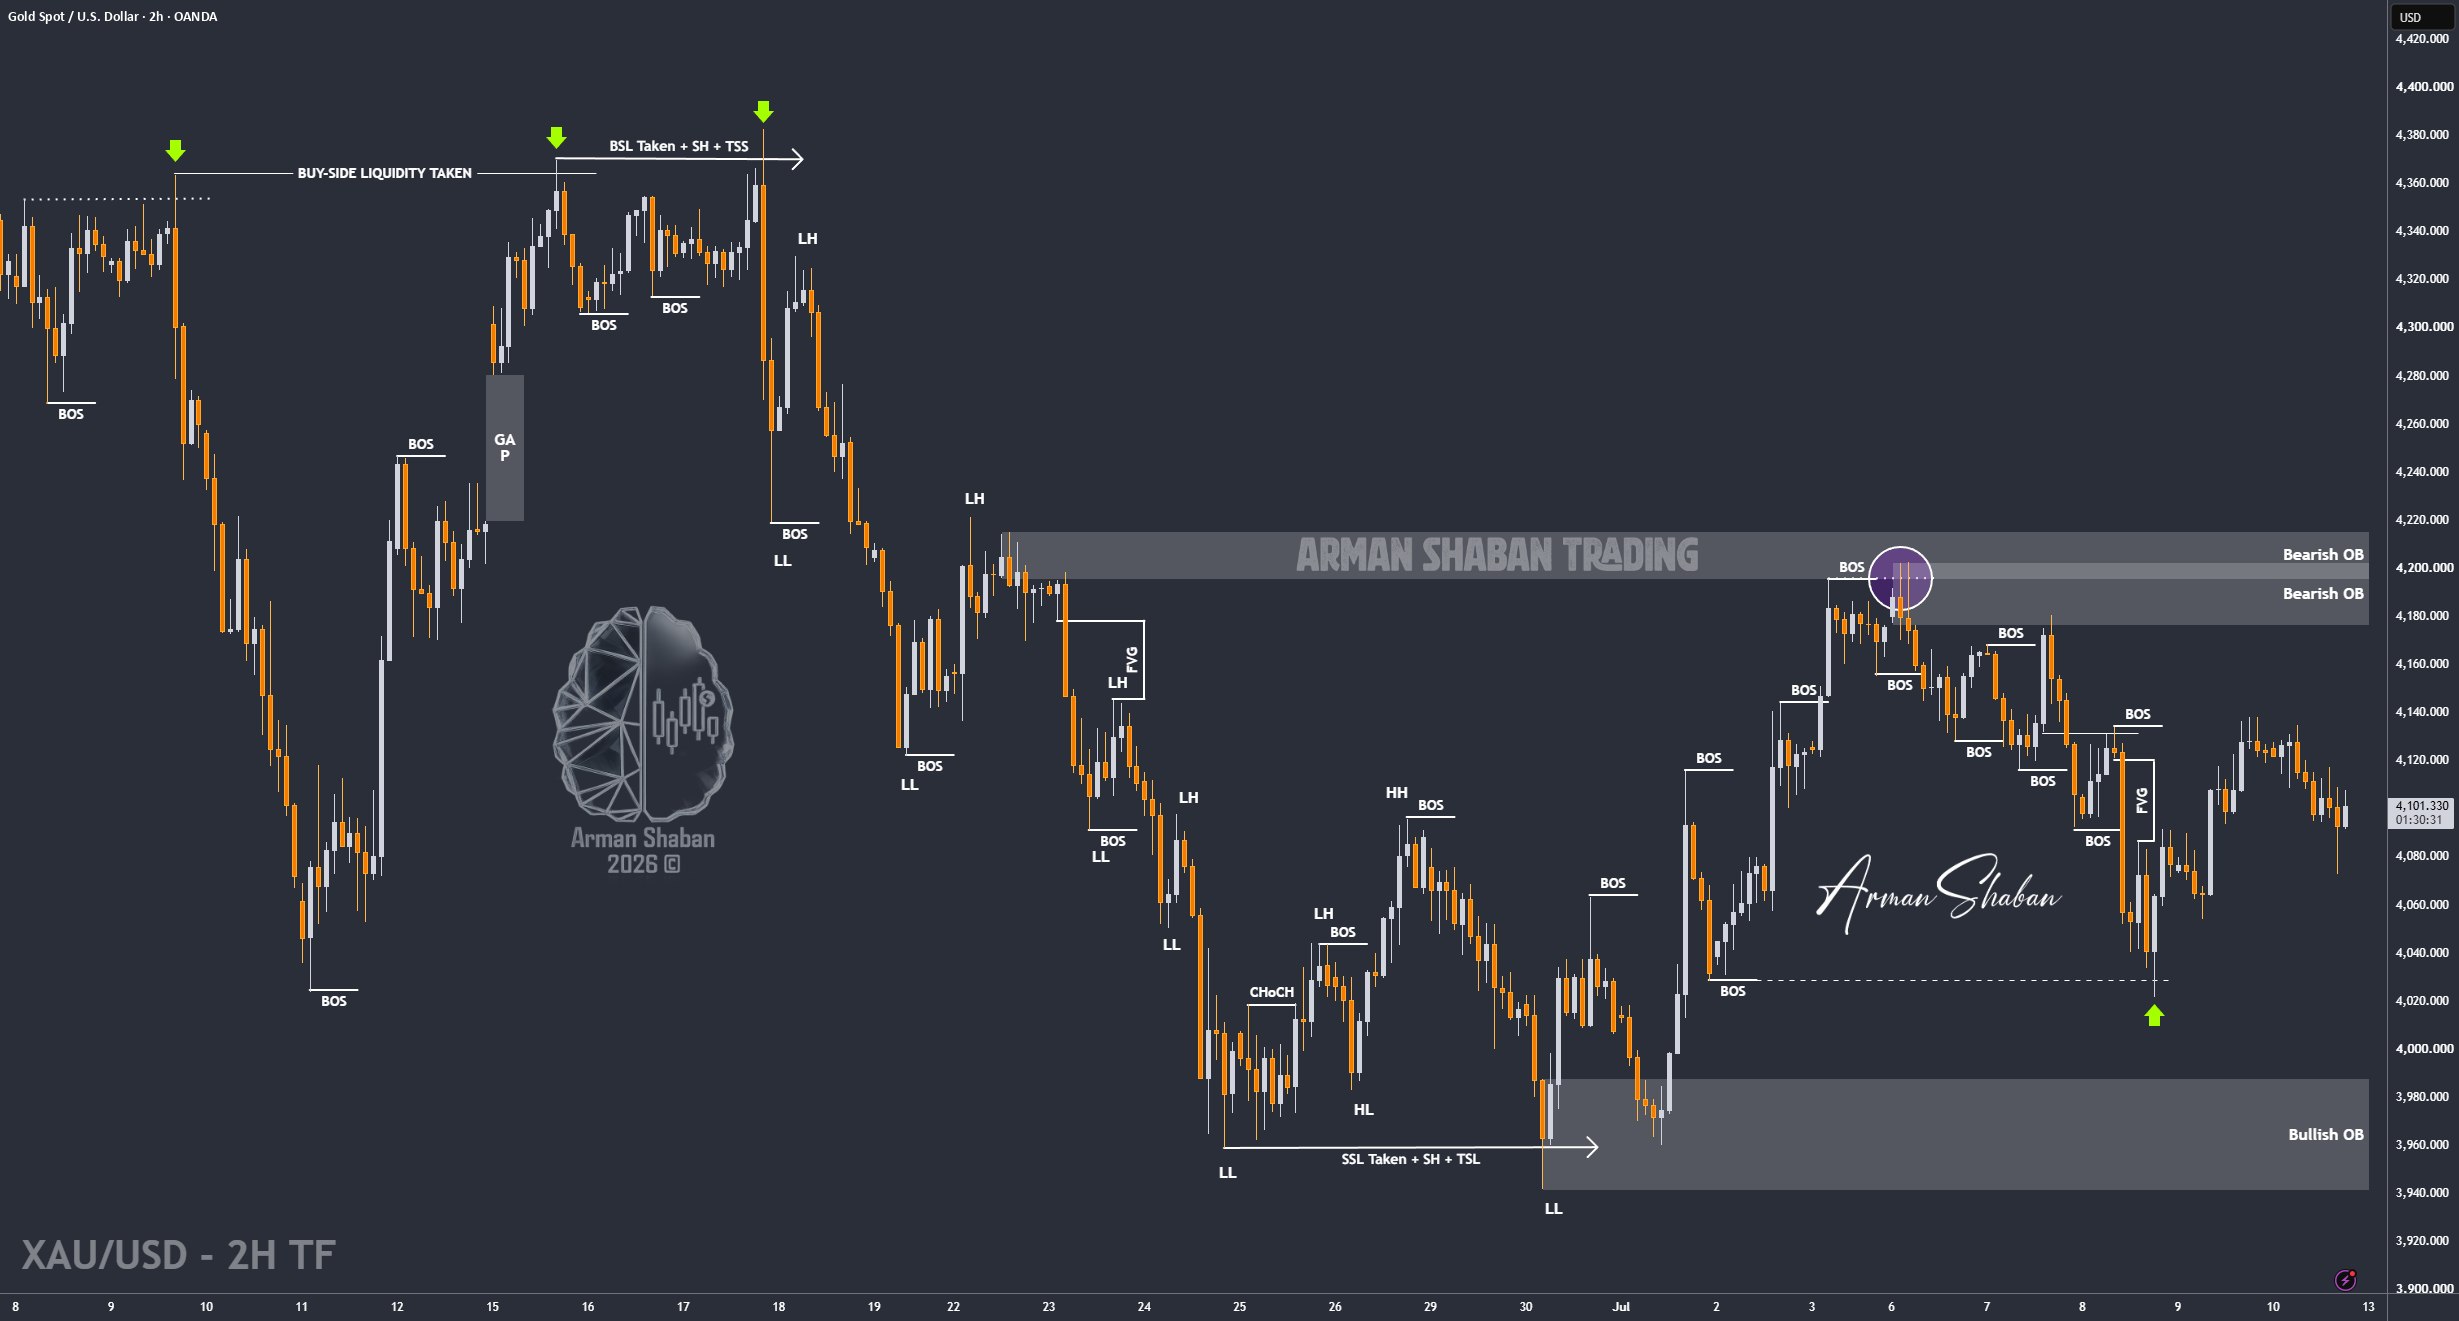
Gold Analysis: By analyzing the #Gold chart on the 2H timeframe, we can see that after the previous update, price started another bullish move and reached the $4138 region. After this rally, Gold entered a corrective phase and dropped toward $4073 following another statement from Trump. Currently, Gold is trading around $4105, and the market remains heavily connected to geopolitical developments.
In this environment, relying too much on one fixed directional scenario can be risky. The most important thing is to identify the key supply and demand zones in advance and stick to the plan.
The nearest demand zones are located around $4070 to $4090, followed by $4020 to $4040. Deeper support remains around $3990 to $4000. On the upside, the nearest supply zones are located around $4115 to $4140, followed by the stronger resistance area between $4160 and $4180.
Personally, I do not recommend chasing price with Market Execution in this kind of market. It is better to mark your levels in advance and use limit orders with proper risk management, without letting emotions influence the trade.
For now, Gold is trading between important supply and demand zones, and the next reaction from these levels will determine the next short-term move.
(This Post on TradingView)
Author : Arman Shaban
To see more analyzes of Gold , Forex Pairs , Cryptocurrencies , Indices and Stocks , be sure to Follow and Join us on other Platforms :
– Public Telegram Channel
– YouTube Channel
– TradingView
– X (Twitter)
– How to join our FOREX VIP Channel ?
– How to join our Crypto VIP Channel ?
– CONTACT ME directly on Telegram

