Gold Analysis – 08.Jul.2026
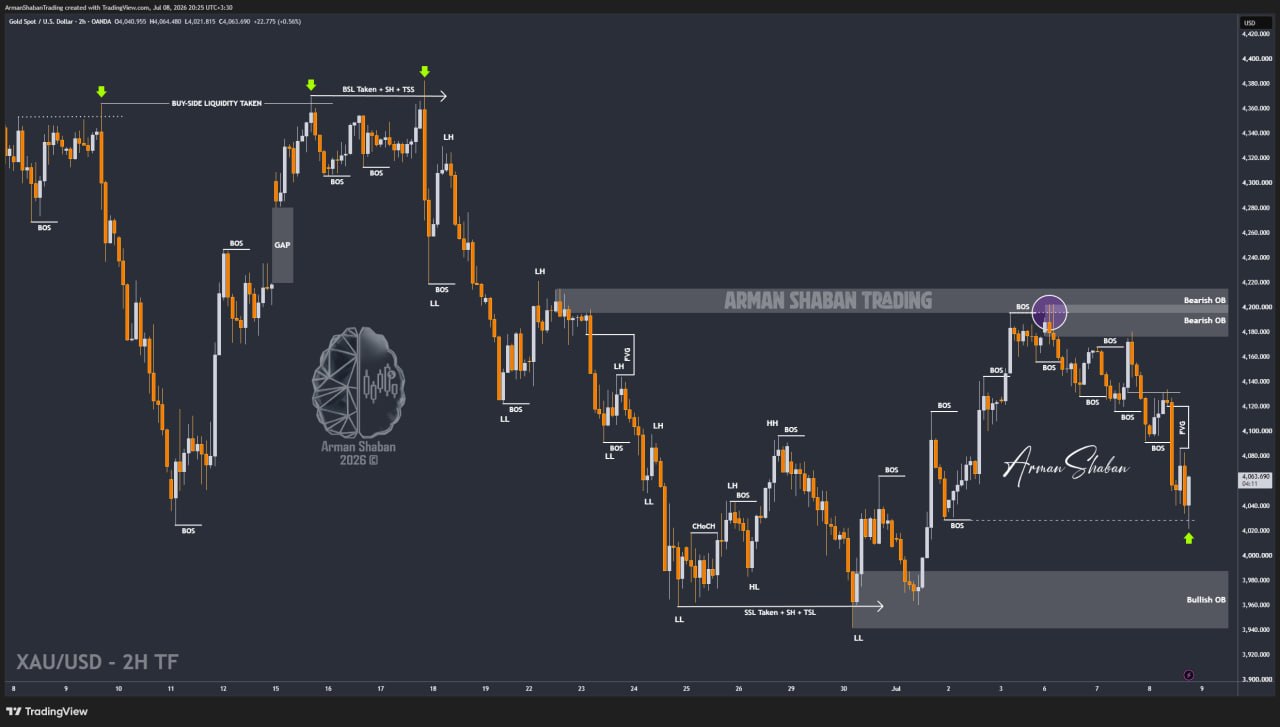
Gold Analysis: By analyzing the #Gold chart on the 2H timeframe, we can see that after the previous analysis, the initial correction we expected did happen. However, price did not stop with a simple pullback. Fresh geopolitical tensions entered the market after renewed attacks between Iran and the United States, which pushed risk sentiment sharply higher. As a result, Oil exploded from around $70 to $80.75, gaining nearly 15% in less than 24 hours, while Gold faced heavy selling pressure and dropped toward the $4021 region.
After reaching $4021, buyers stepped in slightly and Gold is currently trading around $4059. That said, considering the current market conditions, I think it is still too early to talk about a strong bullish recovery unless Trump steps back from his threatening tone and tensions around the Strait of Hormuz calm down again. For now, traders should be extra careful tonight and tomorrow. Volatility is extremely high, and the market can reverse quickly with any new headline.
The nearest demand zones are around $4020 – $4040, followed by $3990 – $4000 and deeper support near $3958 – $3970. On the upside, the nearest supply zones are around $4065 – $4085, followed by $4115 – $4140 and $4160 – $4180. For now, I prefer to focus only on these key supply and demand zones until I publish a fresh and more detailed Gold analysis.
(This Post on TradingView)
Author : Arman Shaban
To see more analyzes of Gold , Forex Pairs , Cryptocurrencies , Indices and Stocks , be sure to Follow and Join us on other Platforms :
– Public Telegram Channel
– YouTube Channel
– TradingView
– X (Twitter)
– How to join our FOREX VIP Channel ?
– How to join our Crypto VIP Channel ?
– CONTACT ME directly on Telegram

