Gold Analysis – 3.Jul.2026
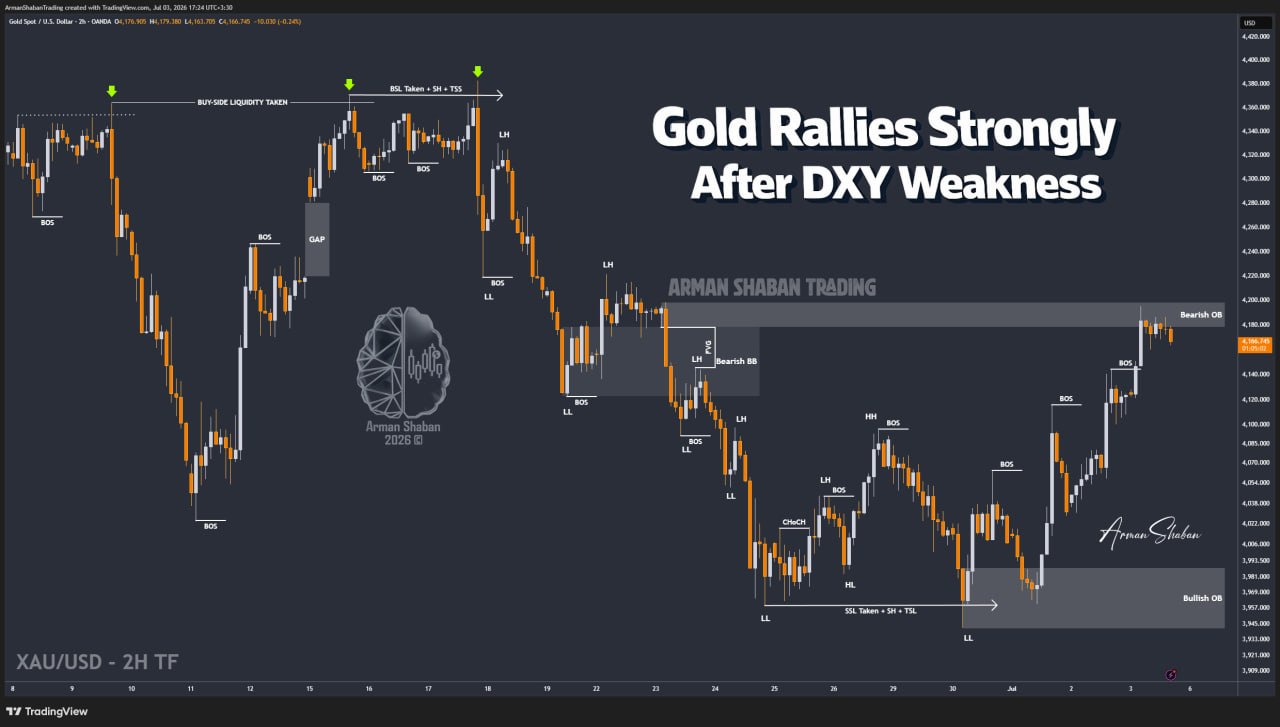
Gold Analysis: By analyzing the #Gold chart on the 2H timeframe, we can see that after the previous update, Gold followed the bullish scenario and first pushed toward the $4120 region. After that, the move continued even stronger as the U.S. Dollar Index weakened, helping Gold extend its rally all the way toward $4195. Currently, Gold is trading around the $4165 region. Since U.S. banks are closed today, I do not expect extremely aggressive movement, but in my view, before any further bullish continuation, Gold may first enter a short-term corrective phase.
The nearest demand zones are located around $4130 – $4150, followed by a deeper support area between $4080 – $4110. On the upside, the closest supply zone is around $4180 – $4200, followed by stronger resistance between $4235 – $4265. If buyers defend the demand zones and momentum returns, the next medium-term upside targets to monitor are $4200, followed by $4235, then $4265, $4300, and potentially $4340 if bullish pressure continues. For now, the short-term view is simple: first a possible correction, then another bullish attempt if buyers continue defending the key demand areas.
(This Post on TradingView)
Author : Arman Shaban
To see more analyzes of Gold , Forex Pairs , Cryptocurrencies , Indices and Stocks , be sure to Follow and Join us on other Platforms :
– Public Telegram Channel
– YouTube Channel
– TradingView
– X (Twitter)
– How to join our FOREX VIP Channel ?
– How to join our Crypto VIP Channel ?
– CONTACT ME directly on Telegram