USD/JPY Analysis – 28.May.2026
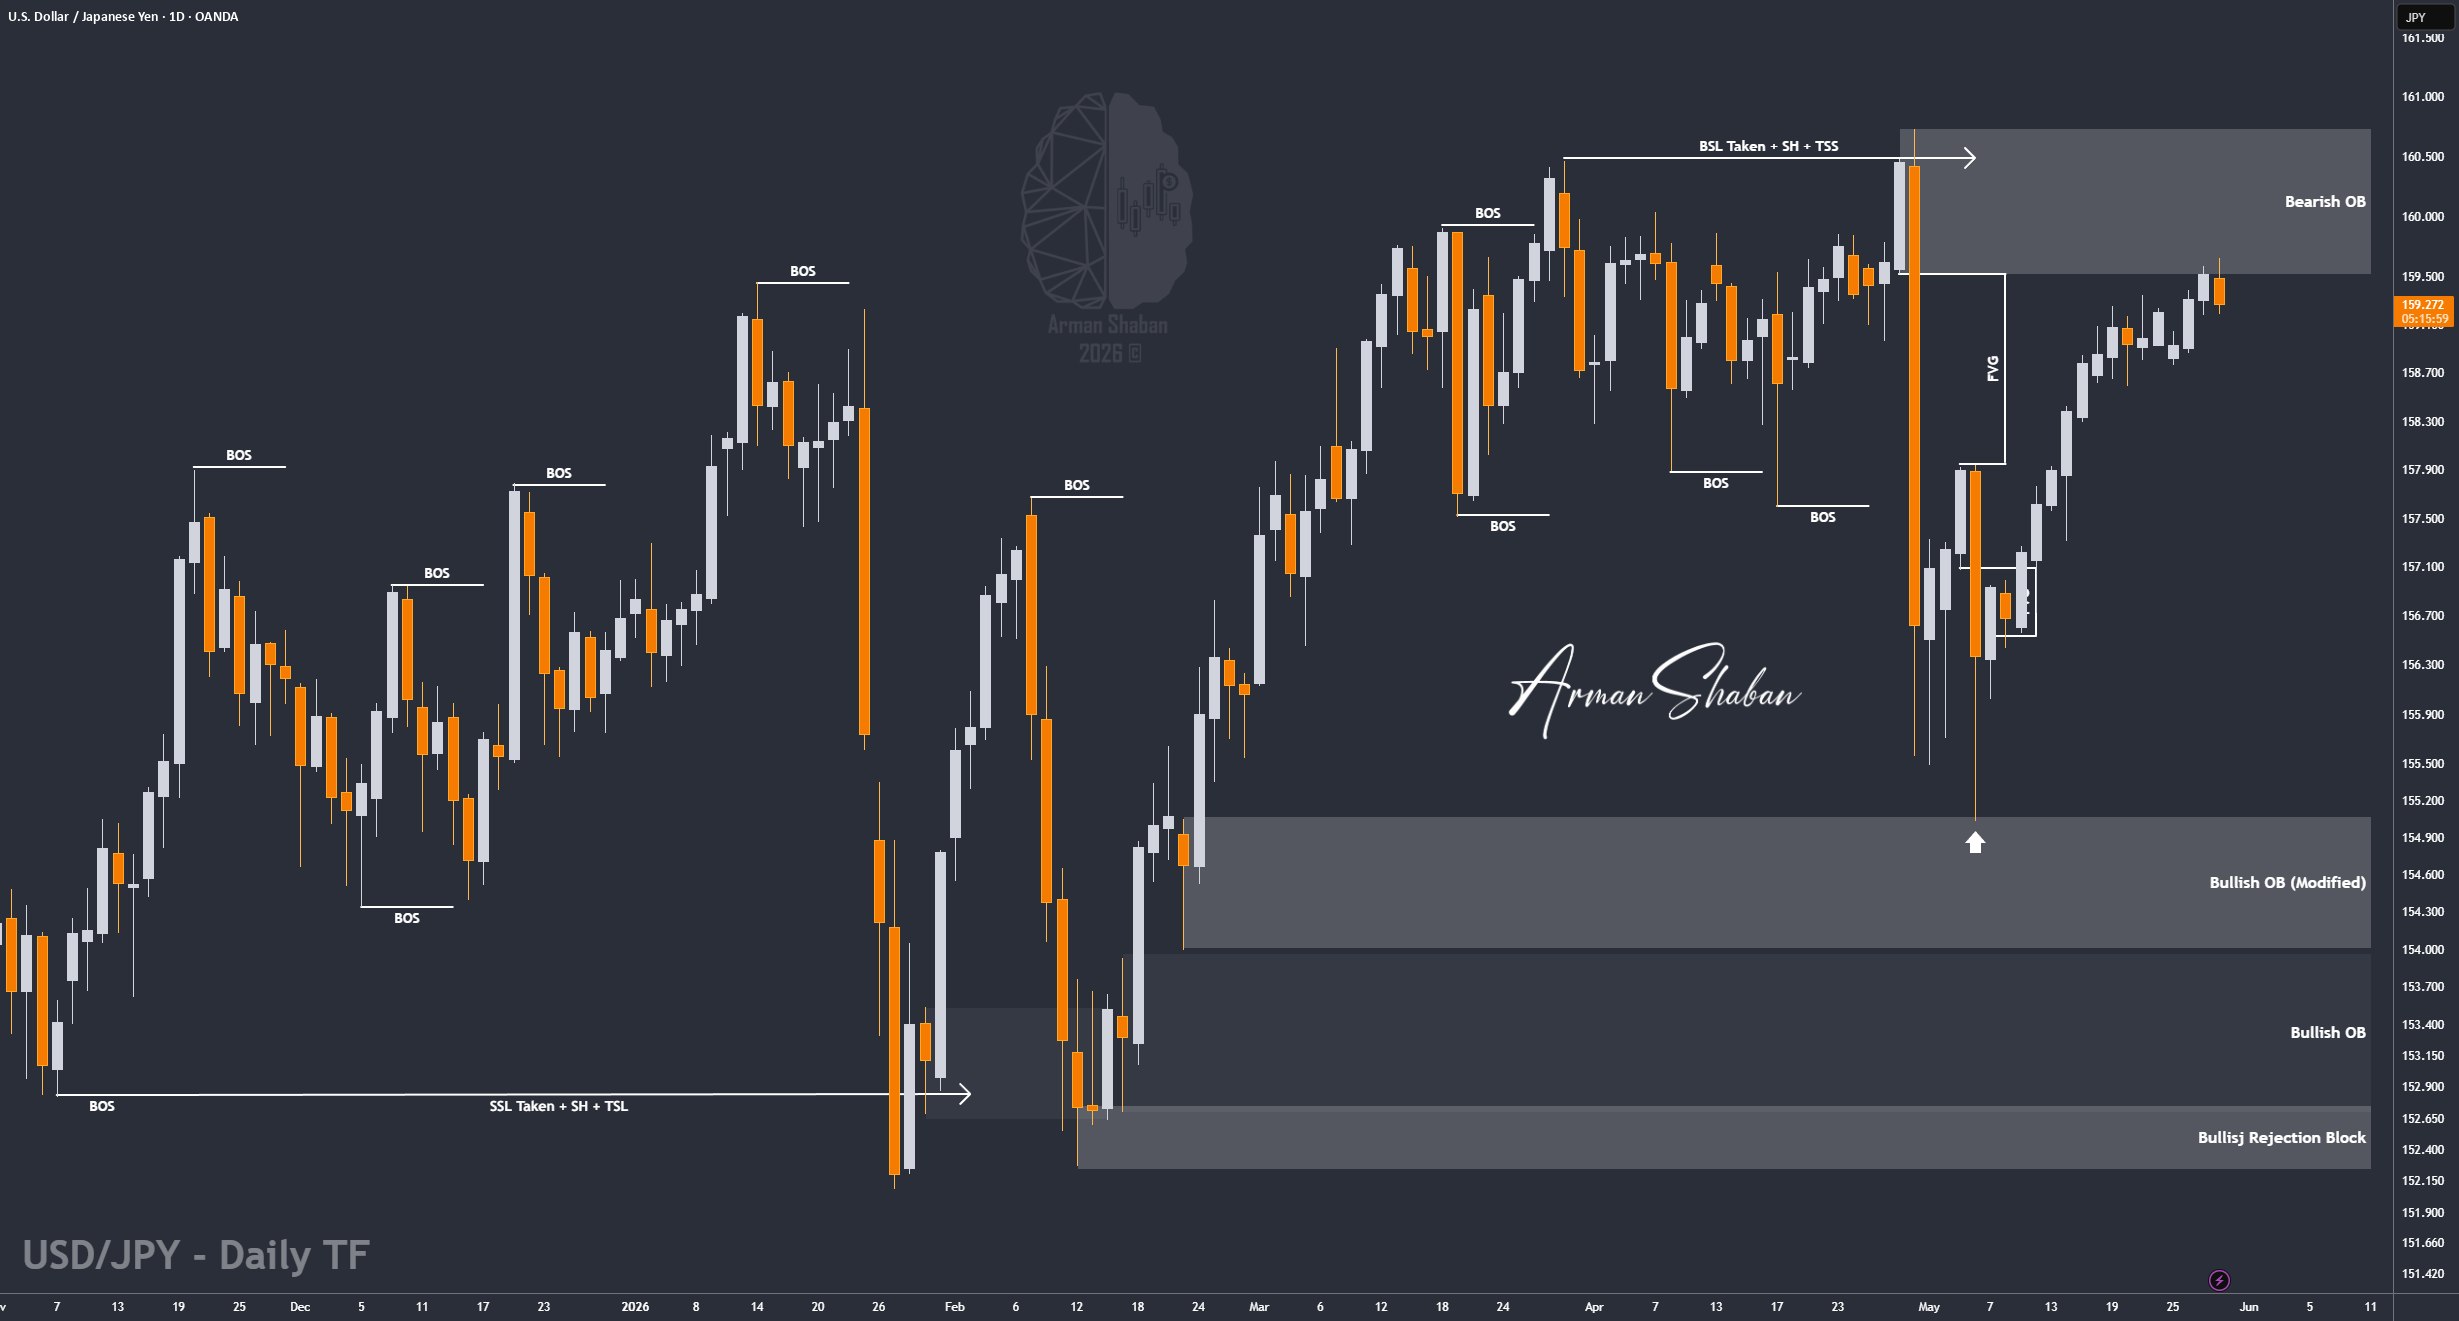
USD/JPY Analysis : By analyzing the #USDJPY chart on the 4H timeframe, we can see that price finally completed the bullish retracement scenario perfectly. USDJPY pushed all the way toward the 159.50 region and successfully filled the large FVG that we had marked on the chart.
Currently, price is trading around 159.20 and this area is becoming a very important supply and resistance zone. In my view, the probability of a larger bearish move from this region is increasing, especially after the full liquidity rebalance and FVG fill.
From a structural perspective, the nearest supply zones are now located around 159.20 – 160.00, followed by the stronger resistance cluster between 160.50 – 161.20. On the downside, the closest demand zones are sitting around 157.00 – 157.50, with deeper structural support near 155.00 – 155.50.
If sellers regain full control from this region, the next short-term and mid-term bearish targets to monitor are 158.00, followed by 157.00, then 155.50, and potentially 154.00 if bearish momentum accelerates further.
Right now, the broader bearish scenario still looks valid to me unless price manages to reclaim and stabilize above the higher supply zones.
(This Post on TradingView)
Author : Arman Shaban
To see more analyzes of Gold , Forex Pairs , Cryptocurrencies , Indices and Stocks , be sure to Follow and Join us on other Platforms :
– Public Telegram Channel
– YouTube Channel
– TradingView
– X (Twitter)
– How to join our FOREX VIP Channel ?
– How to join our Crypto VIP Channel ?
– CONTACT ME directly on Telegram

