Gold Analysis – 28.May.2026
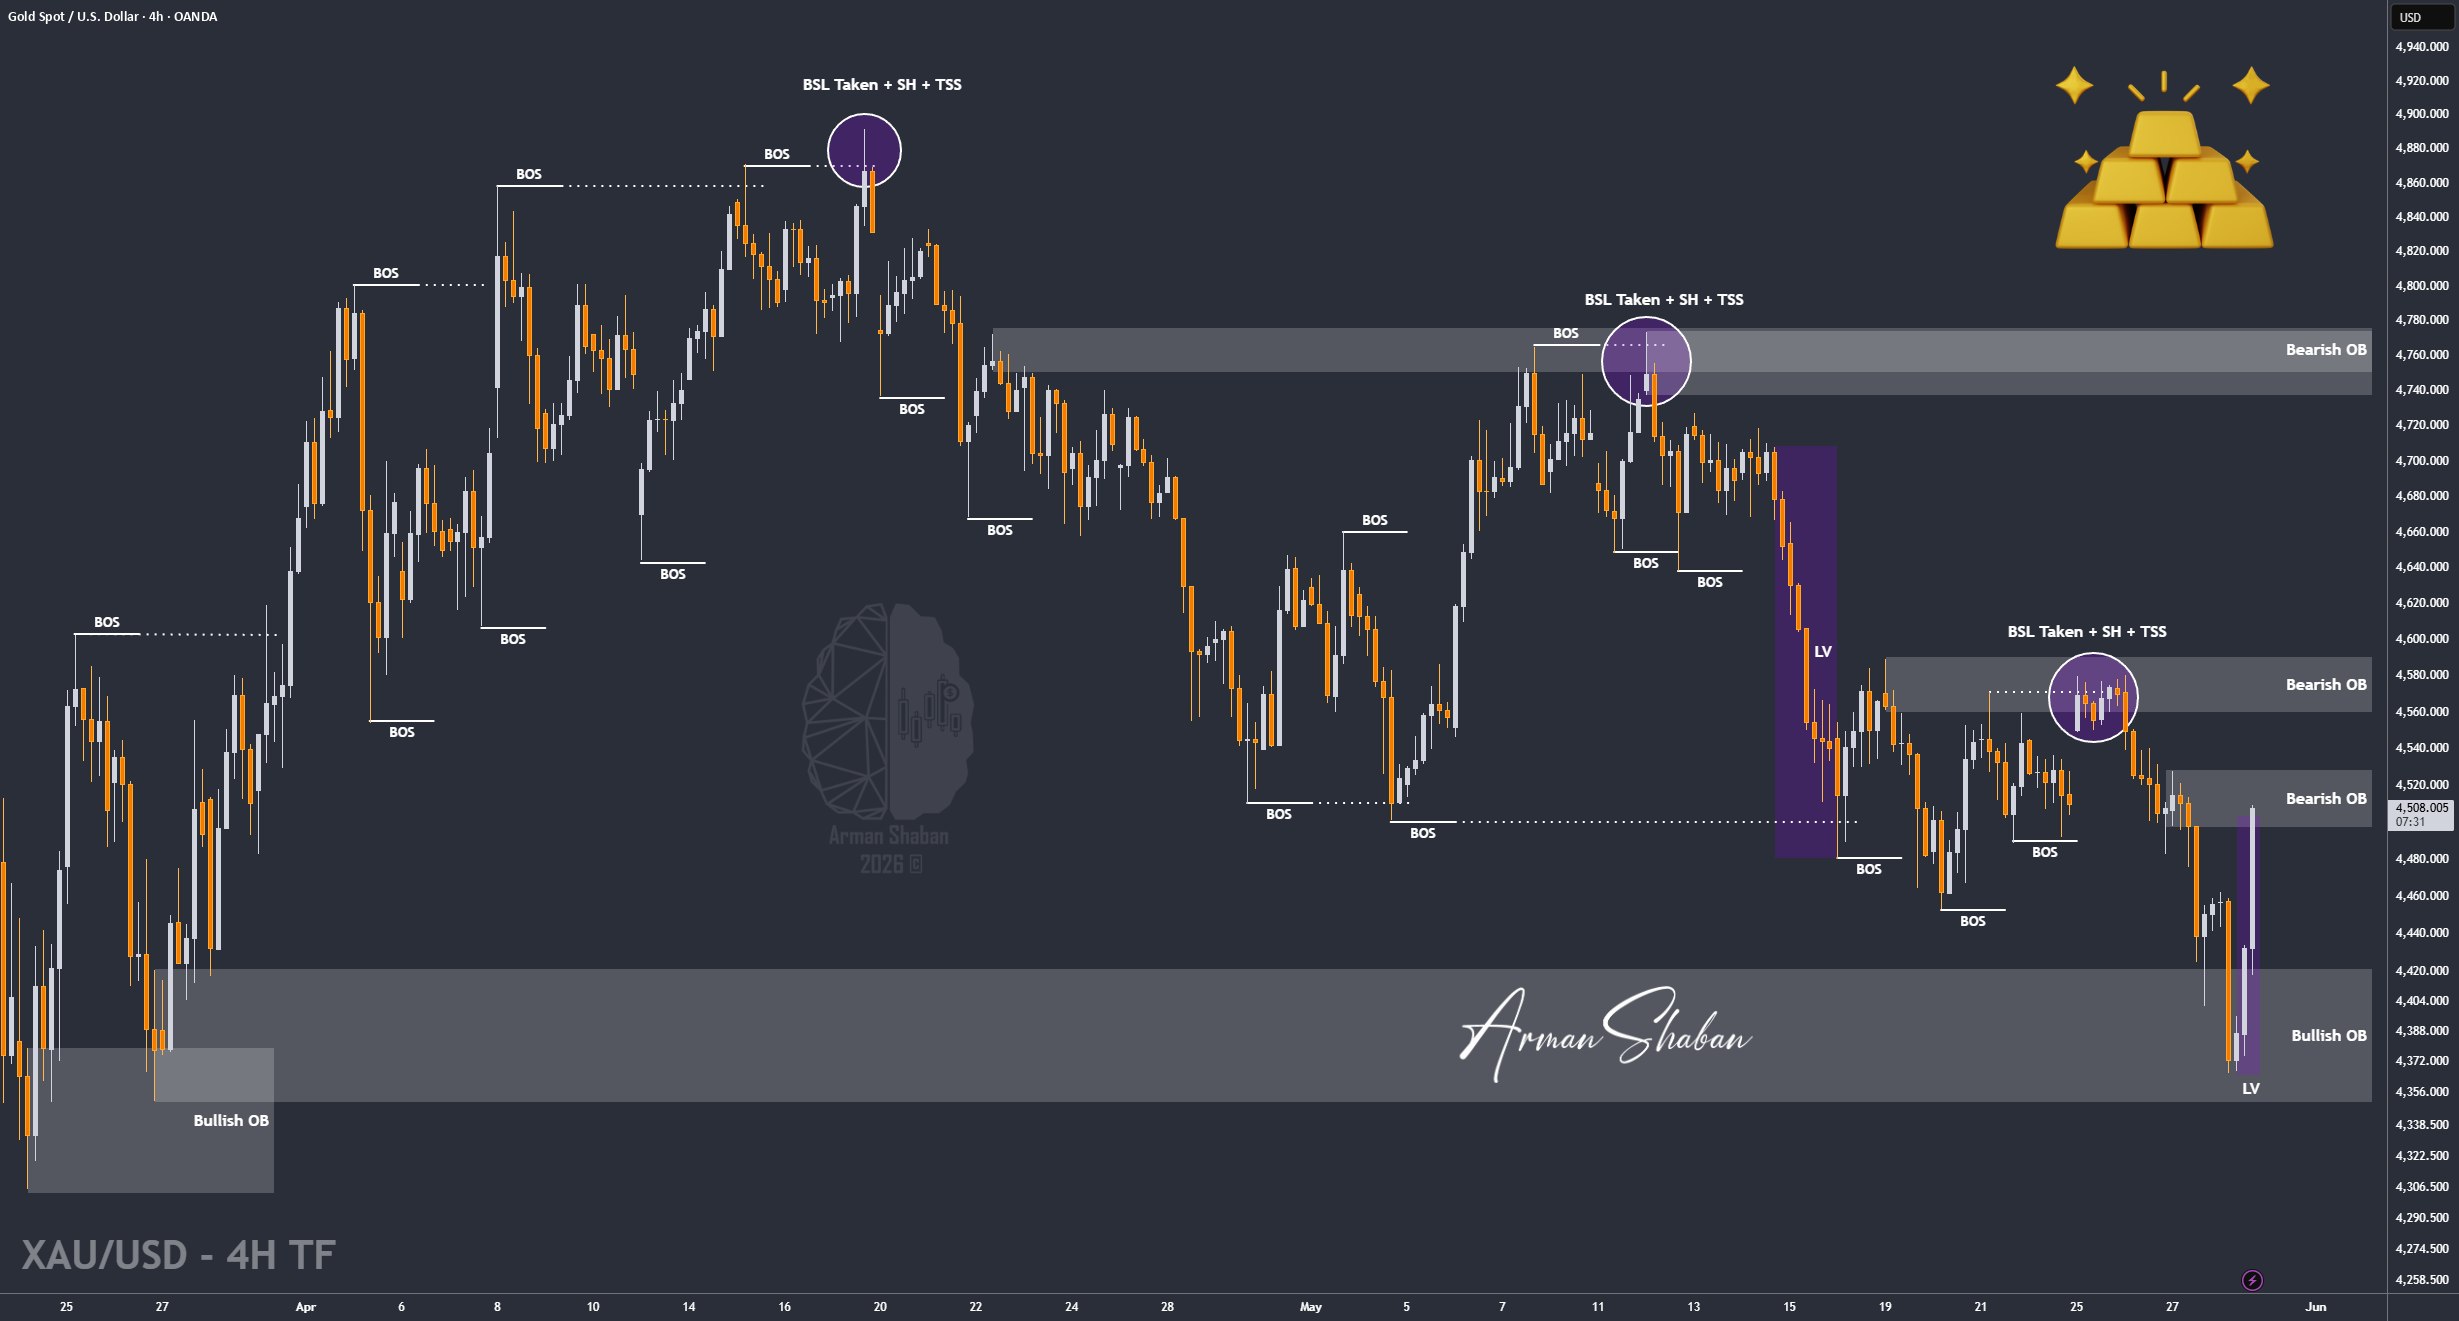
Gold Analysis: By analyzing the #Gold chart on the 4H timeframe, we can see that Gold continued its aggressive bearish move today and dropped all the way toward $4366, marking the lowest price level in nearly the past 2 months.
However, once price entered this major demand zone, the market reacted violently. Right after that move, Trump stated that there is a strong possibility of reaching an agreement with Iran, and this headline immediately triggered a massive bullish reaction across Gold. In less than 10 hours, Gold pumped sharply back toward the $4500 region.
Right now, the first major supply zone is located between $4500 – $4527. If buyers manage to break through this area, the next important resistance and supply cluster sits around $4559 – $4589.
On the downside, the nearest demand zones are now located around $4440 – $4460, followed by a stronger structural demand area between $4380 – $4400. The deepest support zone remains around $4360 – $4370, which is currently acting as the key liquidity base for buyers.
At this stage, the market remains extremely headline-driven and highly sensitive to geopolitical developments. Any new update regarding negotiations or tensions between Iran and the United States could completely shift the direction of Gold again within hours.
(This Post on TradingView)
Author : Arman Shaban
To see more analyzes of Gold , Forex Pairs , Cryptocurrencies , Indices and Stocks , be sure to Follow and Join us on other Platforms :
– Public Telegram Channel
– YouTube Channel
– TradingView
– X (Twitter)
– How to join our FOREX VIP Channel ?
– How to join our Crypto VIP Channel ?
– CONTACT ME directly on Telegram

