Gold Analysis – 01.May.2026
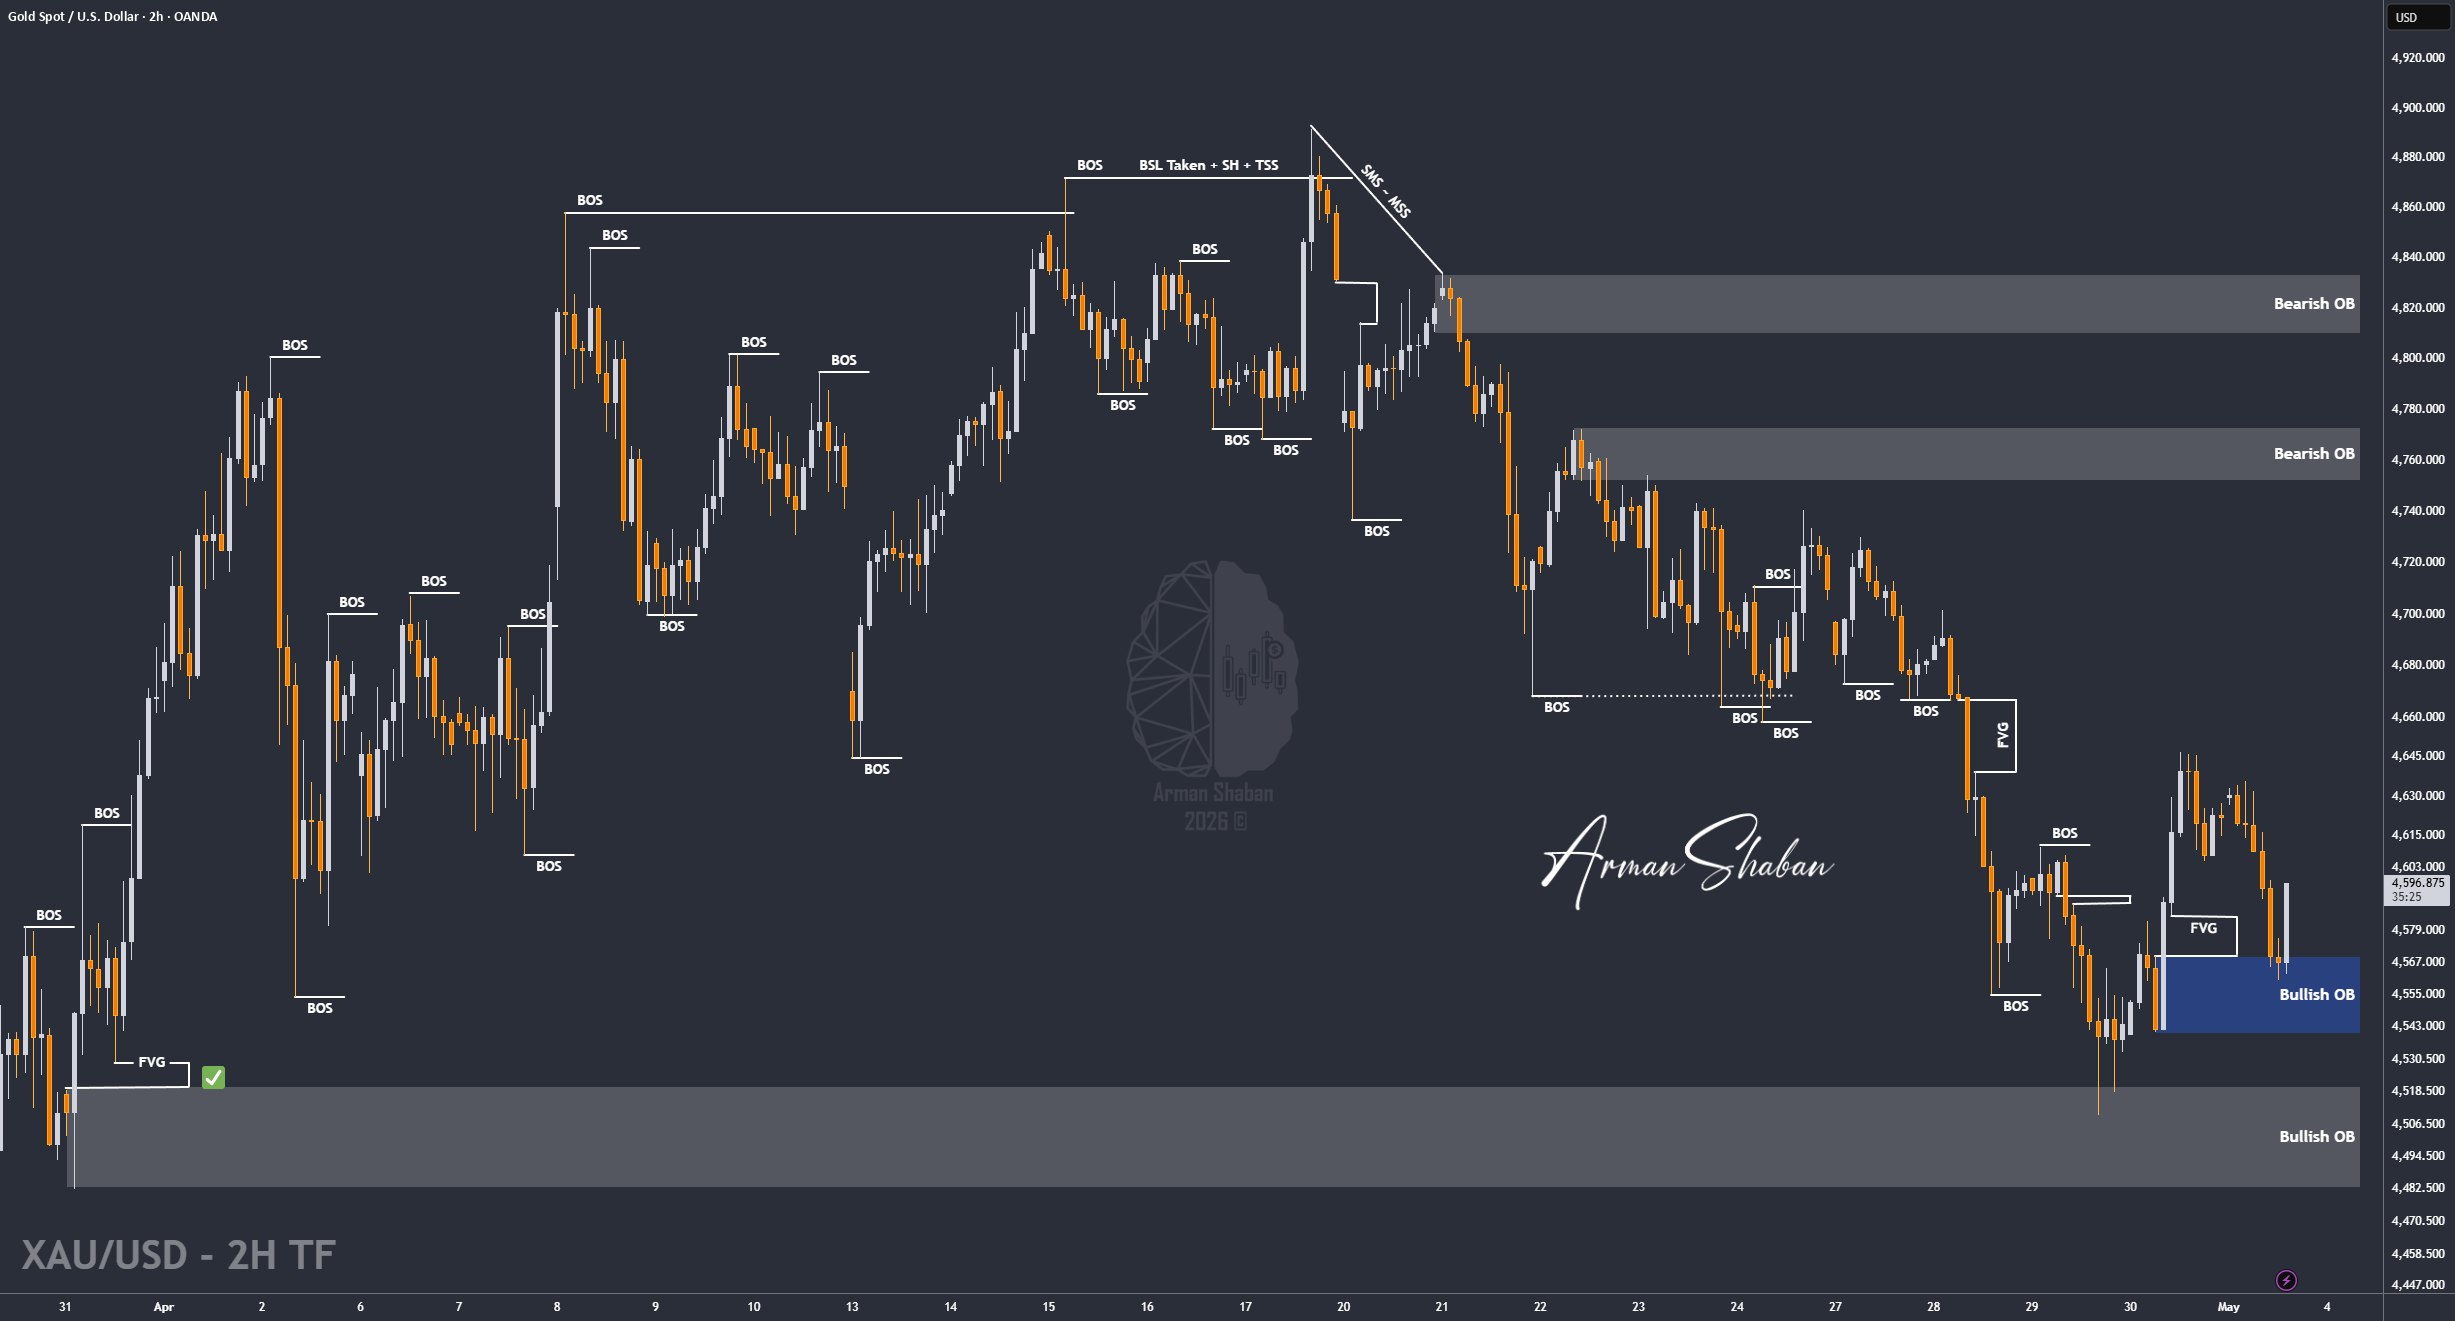
Gold Analysis: By analyzing the #Gold chart on the 4H timeframe, we can see that price followed the bearish scenario perfectly and moved lower to fill the targeted FVG, delivering more than 500 pips of return. As expected, once price reached the Bullish Order Block around $4540 – $4570, strong demand stepped in and triggered a clear bullish reaction.
Following this reaction, Gold has pushed higher and is currently trading around the $4585 region, showing early signs of a short-term recovery after the corrective move.
From a structural perspective, the $4540 – $4570 zone is now confirmed as a valid demand area. As long as price holds above this region, we can expect further upside continuation toward the nearest supply zones around $4600 – $4620, followed by $4640 – $4660.
If buyers maintain control, the next short-term upside targets are $4600, then $4620, and potentially $4650. However, if price fails to hold above the demand zone, the market could revisit lower liquidity levels again.
(This Post on TradingView)
Author : Arman Shaban
To see more analyzes of Gold , Forex Pairs , Cryptocurrencies , Indices and Stocks , be sure to Follow and Join us on other Platforms :
– Public Telegram Channel
– YouTube Channel
– TradingView
– X (Twitter)
– How to join our FOREX VIP Channel ?
– How to join our Crypto VIP Channel ?
– CONTACT ME directly on Telegram