Gold Analysis – 28.Apr.2026
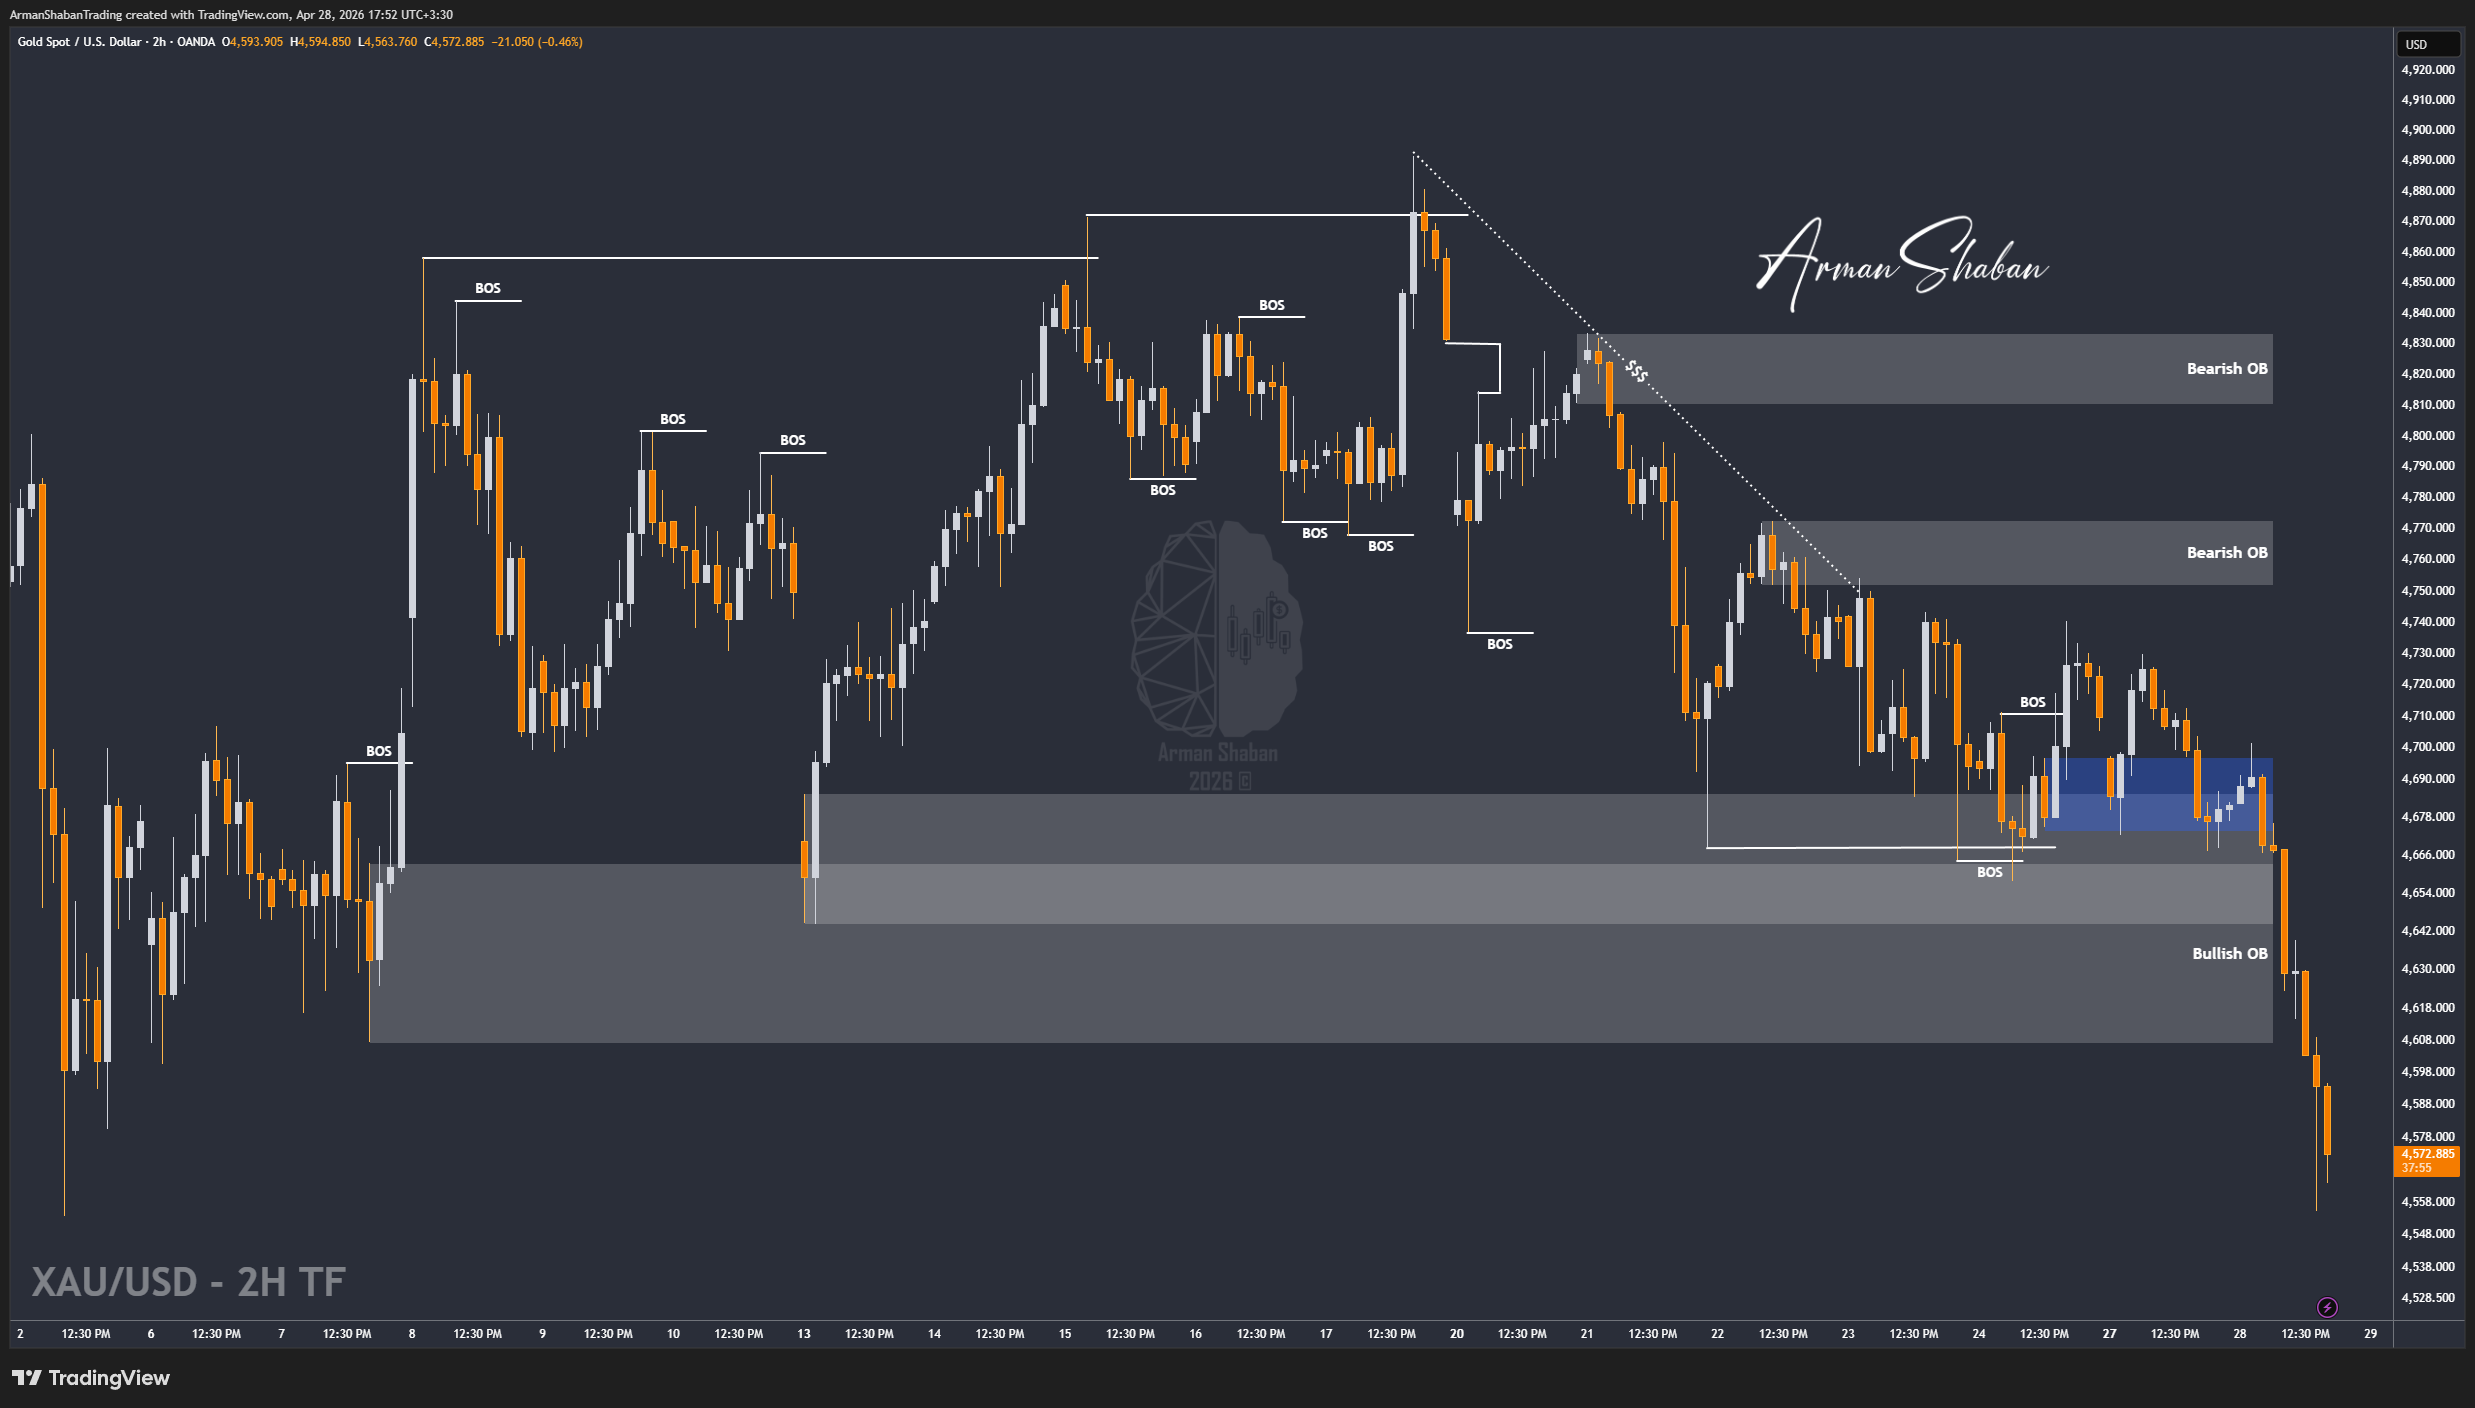
Gold Analysis: By analyzing the #Gold chart on the 4H timeframe, we can see that price completely invalidated the previous stabilization scenario and followed the bearish path aggressively. With rising geopolitical tensions, Gold dropped sharply, sweeping all downside liquidity and hitting all projected bearish targets, reaching a low around $4555. Currently, price is trading near the $4570 region, showing weak and unstable price action after the heavy sell-off.
From a structural perspective, the market is now clearly in a strong bearish phase. The nearest supply zones are forming around $4600 – $4630, followed by a stronger resistance cluster between $4680 – $4720. On the downside, the closest demand zones are now located around $4520 – $4550, with deeper support sitting near $4450 – $4480.
In my view, as long as price remains below the $4600 level, the probability of further downside remains high. Any pullback into supply zones is likely to be sold into. The next short-term downside targets to monitor are $4520, followed by $4480, and potentially $4450 if bearish momentum continues to build.
(This Post on TradingView)
Author : Arman Shaban
To see more analyzes of Gold , Forex Pairs , Cryptocurrencies , Indices and Stocks , be sure to Follow and Join us on other Platforms :
– Public Telegram Channel
– YouTube Channel
– TradingView
– X (Twitter)
– How to join our FOREX VIP Channel ?
– How to join our Crypto VIP Channel ?
– CONTACT ME directly on Telegram