Gold Analysis – 23.Apr.2026
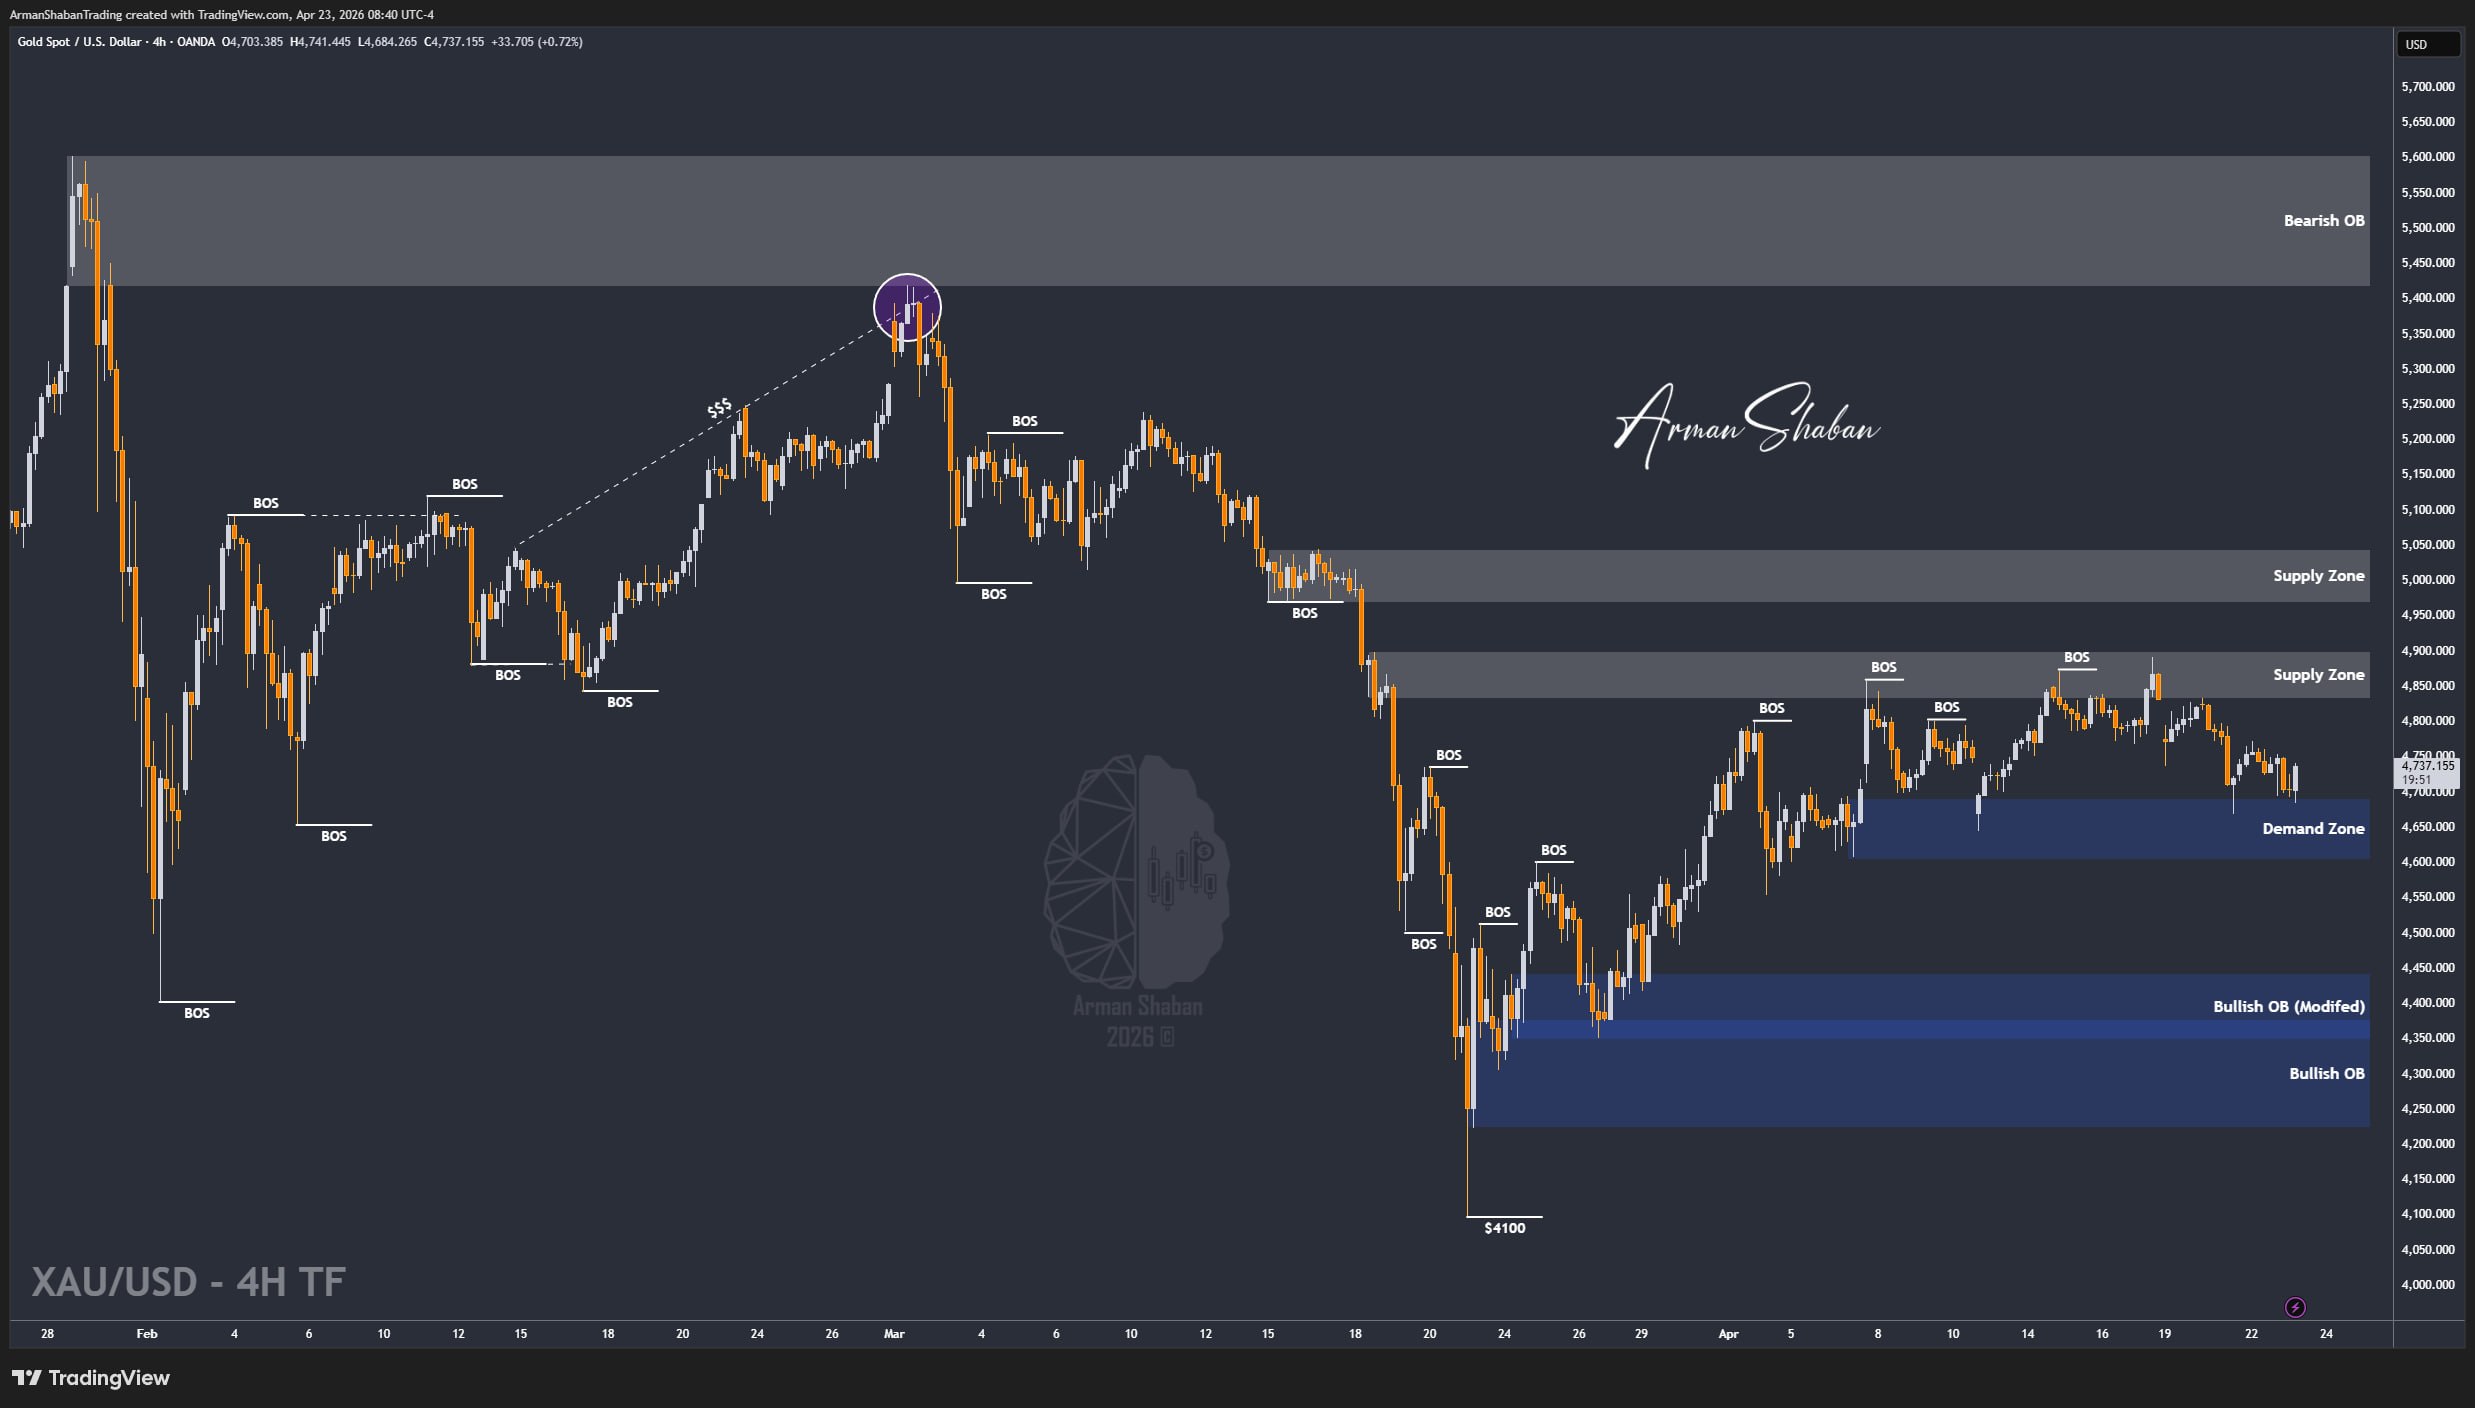
Gold Analysis: By analyzing the #Gold chart on the 4H timeframe, we can see that price once again followed the expected path. After rejecting from the $4750 zone, Gold dropped toward the $4685 demand, where buyers stepped in and pushed price back up to around $4740.
Now the market is sitting right below a key resistance. If price breaks and holds above $4750, we can expect further upside expansion.
From a structural perspective, the nearest demand zones are $4680 – $4700, with deeper support around $4620 – $4650. On the upside, the closest supply zones are $4750 – $4770, followed by $4800 – $4830 as a stronger resistance area.
If buyers manage to break this level, the next short-term upside targets are $4770, followed by $4790, then $4815, and potentially $4840 if momentum builds.
(This Post on TradingView)
Author : Arman Shaban
To see more analyzes of Gold , Forex Pairs , Cryptocurrencies , Indices and Stocks , be sure to Follow and Join us on other Platforms :
– Public Telegram Channel
– YouTube Channel
– TradingView
– X (Twitter)
– How to join our FOREX VIP Channel ?
– How to join our Crypto VIP Channel ?
– CONTACT ME directly on Telegram