Gold Analysis – 05.Mar.2025
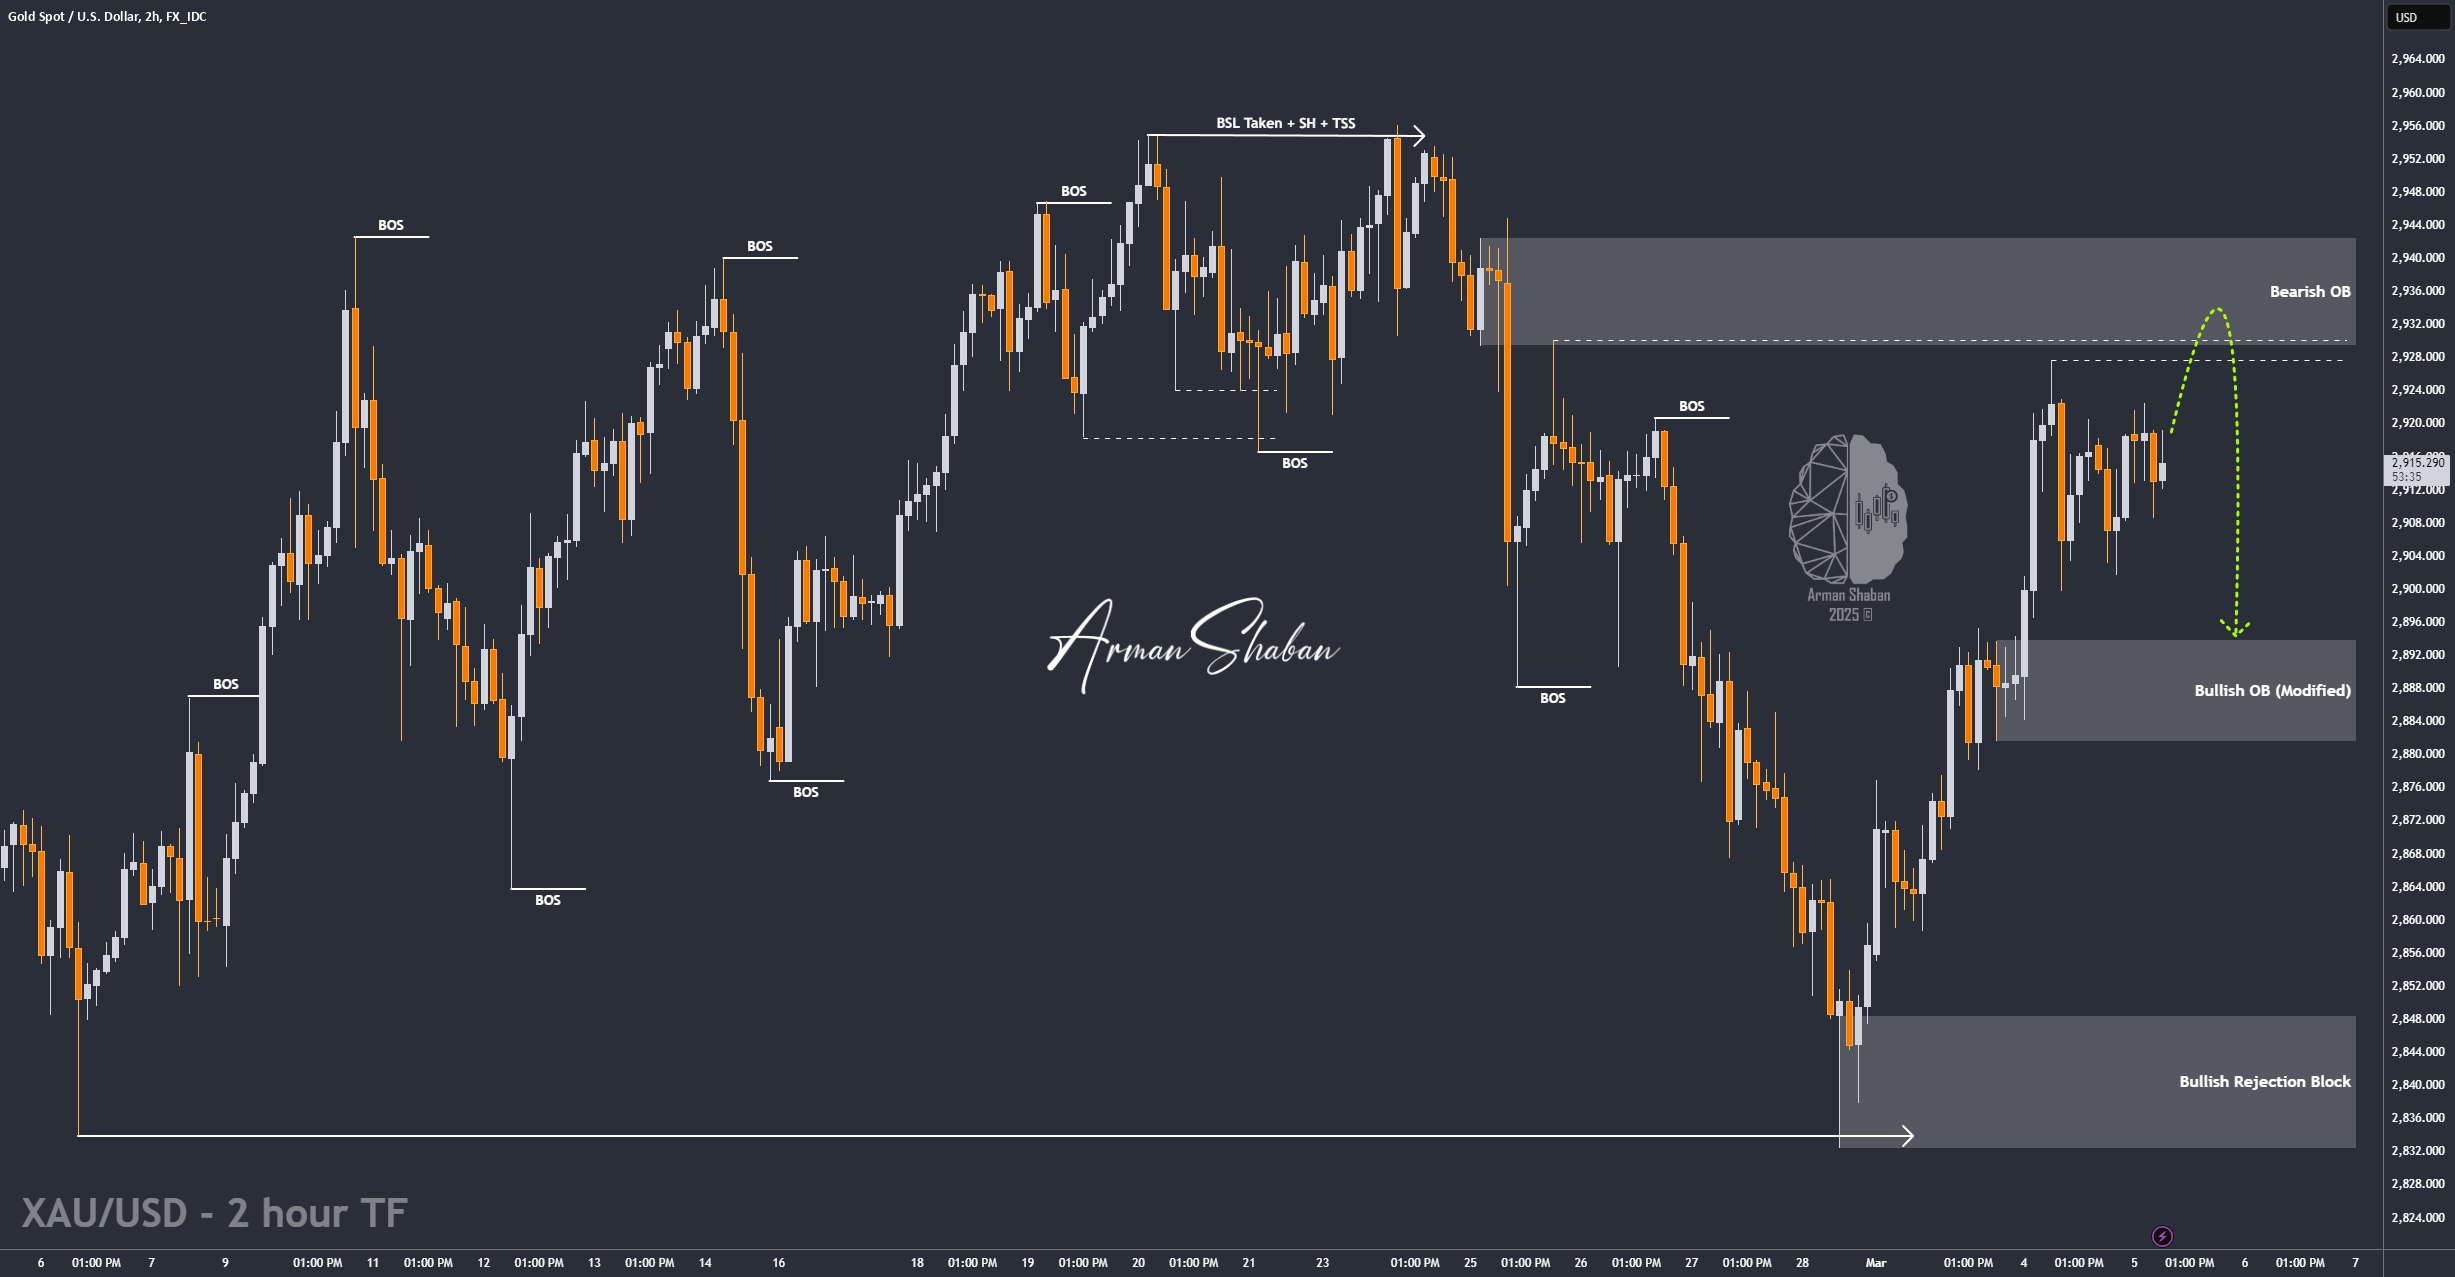
Gold Analysis: By analyzing the gold chart on the two-hour timeframe, we can see that the price started declining as expected yesterday, correcting from $2928 to $2900. Currently, gold is trading around $2916. A key liquidity pool exists in the $2928 – $2930 zone, and if the price moves up to this range, we may see liquidity collection followed by further downside movement. As long as gold trades below $2930, we can anticipate further corrections. However, if gold breaks and stabilizes above $2930, it could push higher toward levels above $2950. Therefore, our primary scenario remains bearish, and we should closely monitor price reactions at the key resistance zones.
(This Post on TradingView)
Author : Arman Shaban
To see more analyzes of Gold , Forex Pairs , Cryptocurrencies , Indices and Stocks , be sure to Follow and Join us on other Platforms :
– Public Telegram Channel
– YouTube Channel
– TradingView
– X (Twitter)
– How to join our FOREX VIP Channel ?
– How to join our Crypto VIP Channel ?
– CONTACT ME directly on Telegram