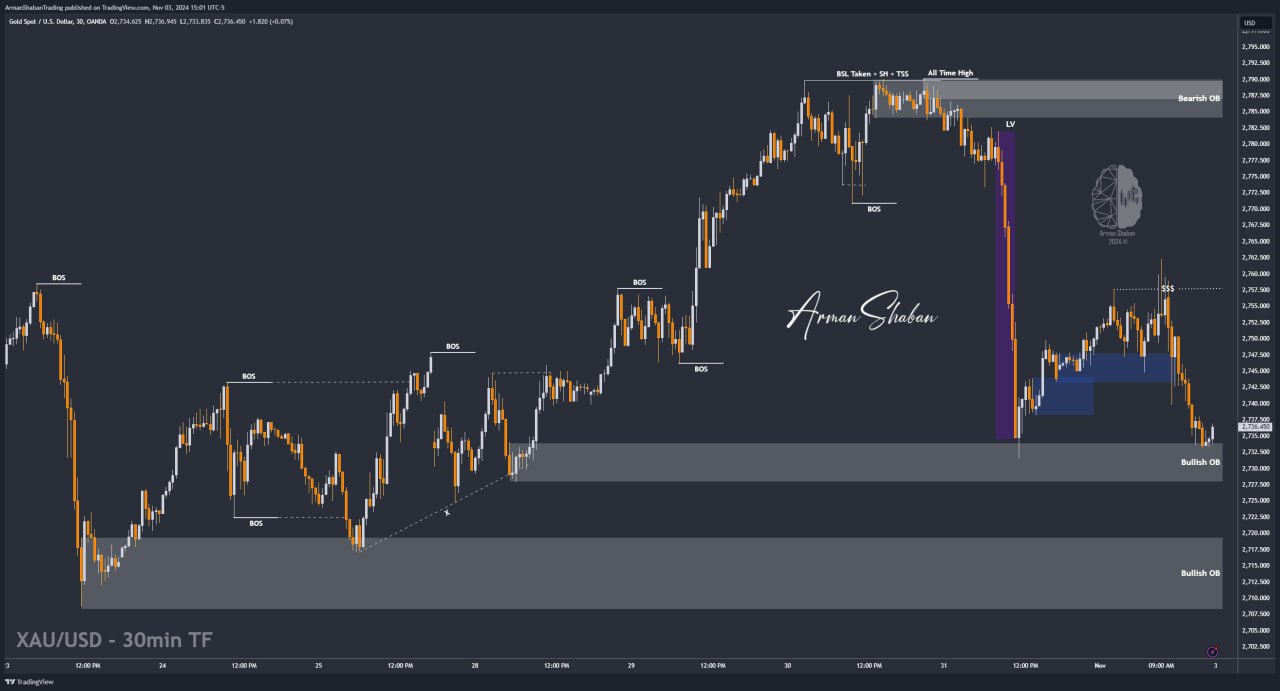
Gold Analysis – 03.Nov.2024

Gold Analysis: By analyzing the #Gold chart in the 30-minute timeframe, we can see that last week, after the NFP data was released below the forecast, gold moved as expected towards the liquidity pool marked on the chart and reached the target of $2762. After capturing the liquidity above this level, gold faced a decline and, upon re-entering the $2733 zone, encountered minor demand, ultimately closing at $2736.450.
(This Post on TradingView)
Author : Arman Shaban
To see more analyzes of Gold , Forex Pairs , Cryptocurrencies , Indices and Stocks , be sure to Follow and Join us on other Platforms :
– Public Telegram Channel
– YouTube Channel
– TradingView
– X (Twitter)
– How to join our FOREX VIP Channel ?
– How to join our Crypto VIP Channel ?
– CONTACT ME directly on Telegram