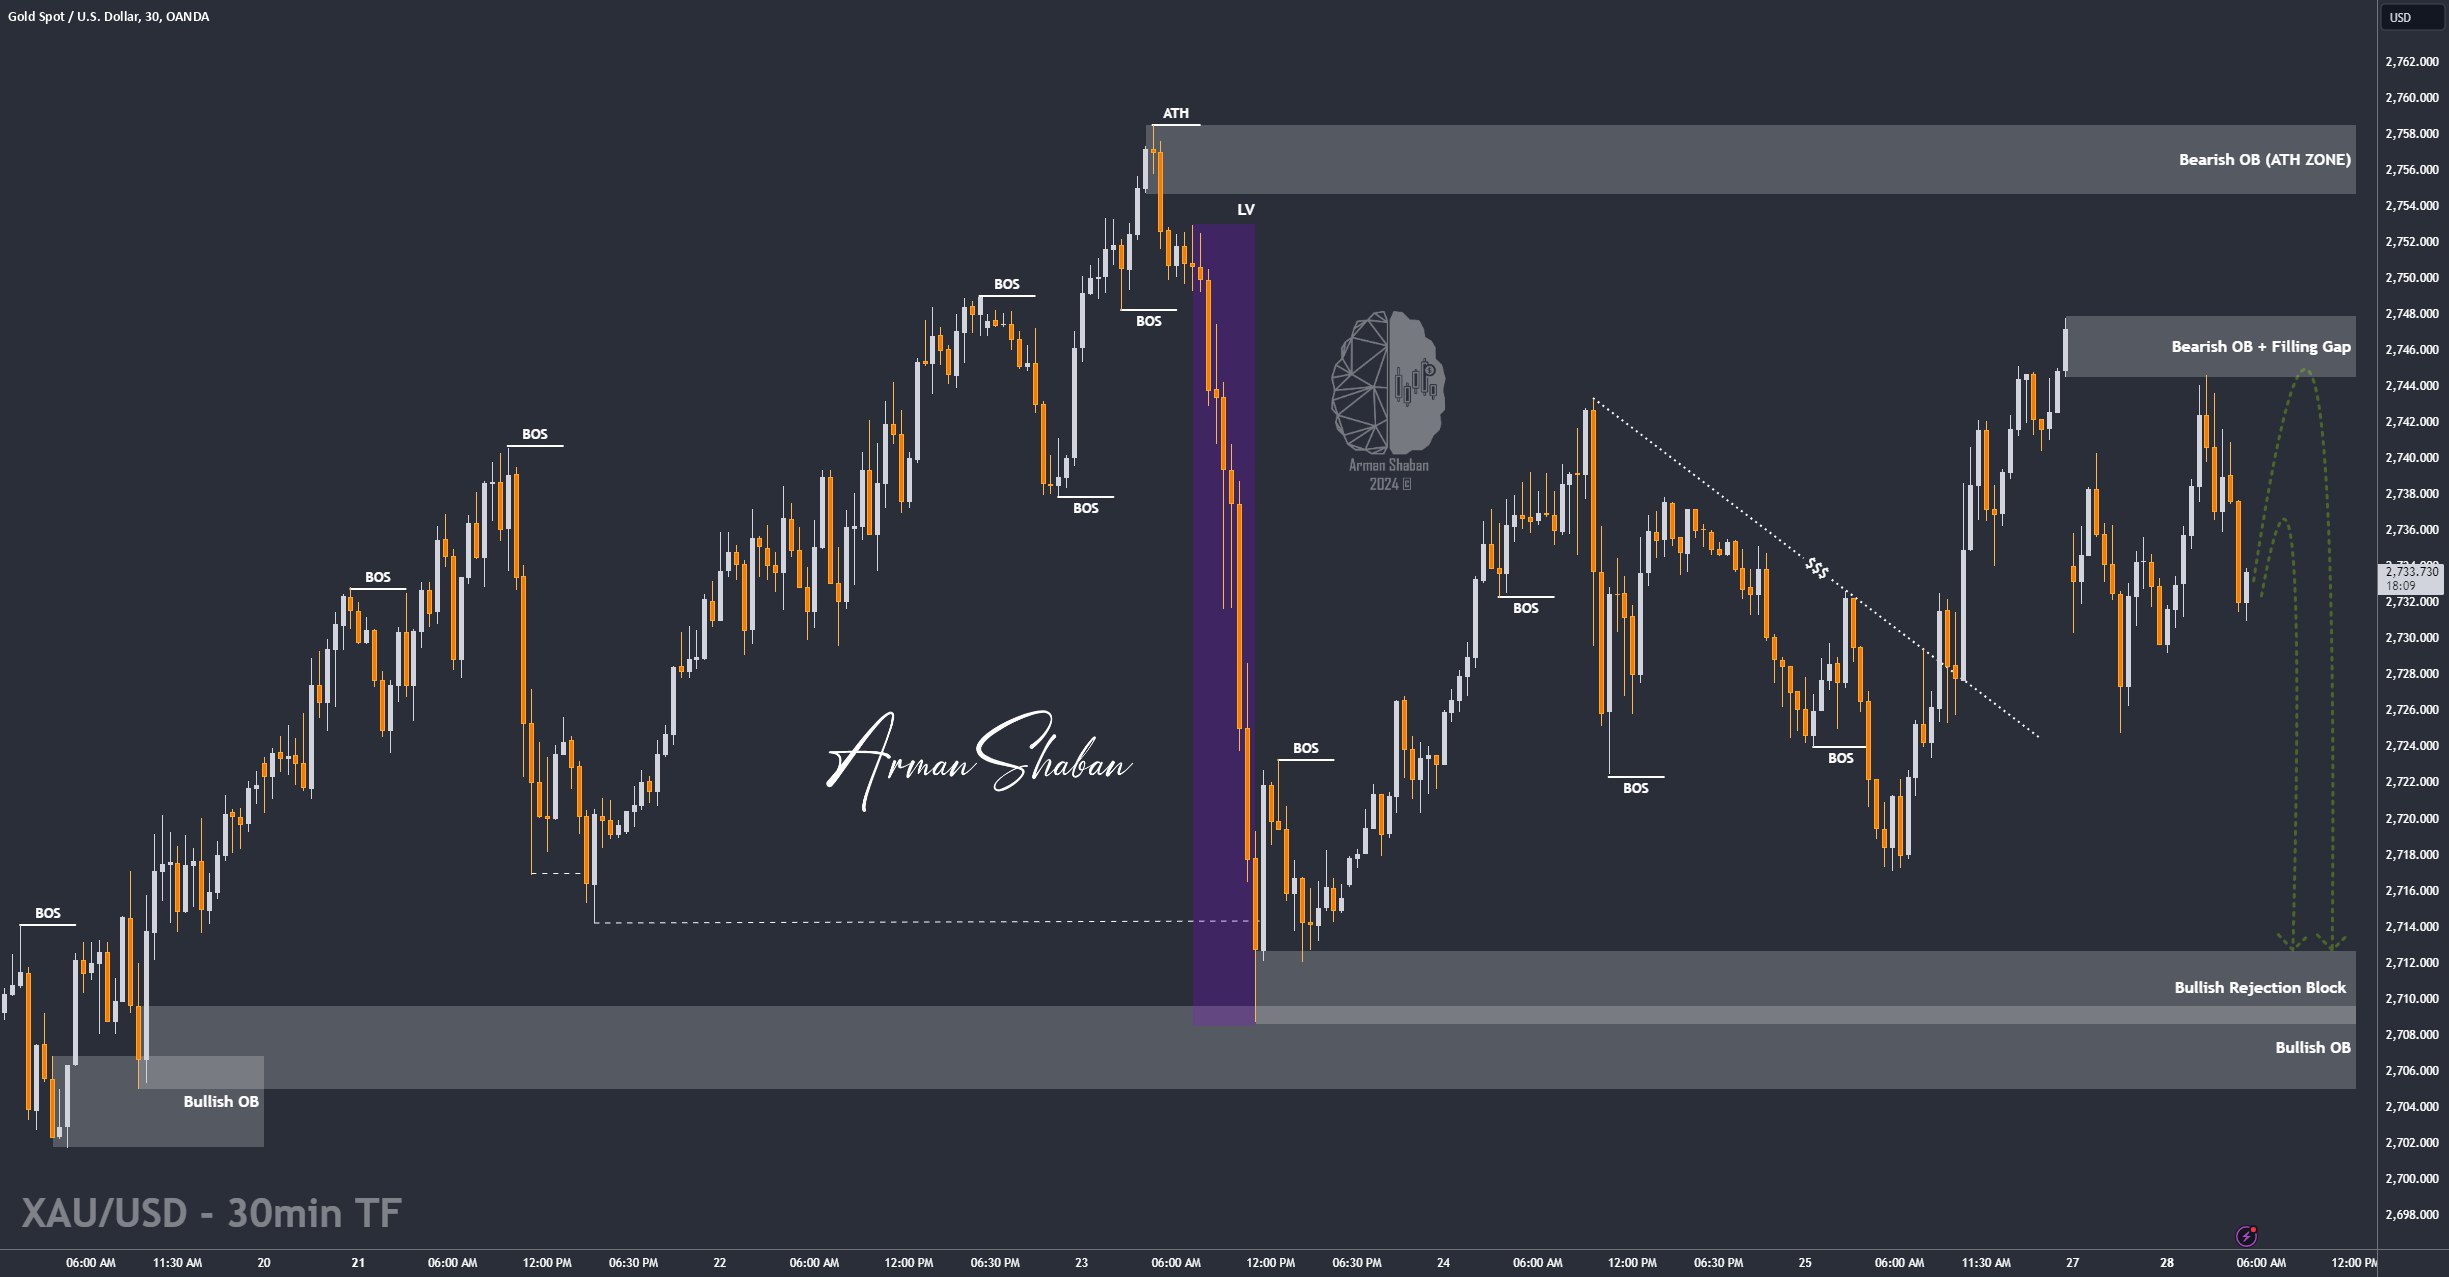
Gold Analysis – 28.Oct.2024

Gold Analysis: By analyzing the #Gold chart in the 30-minute timeframe, we can see that last week, before filling the gap between $2715.5 and $2716.5, the price started rising from the $2717 area and managed to reach $2747.7. After closing at this level on Friday, we saw that over the weekend, with global markets closed, Israel launched its attack on Iran. However, since this attack was lighter than expected, the markets opened today with a large negative gap in gold. The price opened around $2734, with over a 130-pip gap, but within a few hours, this gap was filled as the price rose to $2744. As you can see on the chart, there are currently two remaining price gaps. One is between $2715.5 and $2716.5, and the other is between $2744.5 and $2747.2. Which gap do you think will be filled first?
(This Post on TradingView)
Author : Arman Shaban
To see more analyzes of Gold , Forex Pairs , Cryptocurrencies , Indices and Stocks , be sure to Follow and Join us on other Platforms :
– Public Telegram Channel
– YouTube Channel
– TradingView
– X (Twitter)
– How to join our FOREX VIP Channel ?
– How to join our Crypto VIP Channel ?
– CONTACT ME directly on Telegram