me@armanshaban.com

Tag: fundamental analysis

Crypto Blockchain Bitcoin Ethereum Gold Master Arman Shaban

Bitcoin Analysis – 06.Aug.2025

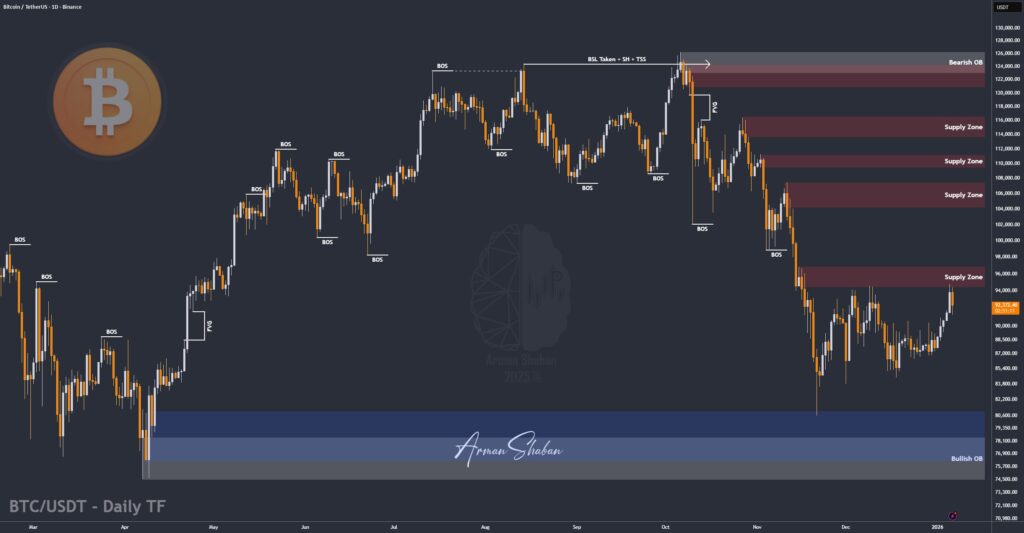
Bitcoin Analysis: By analyzing the Bitcoin chart on the 4-hour timeframe, we can see that after reaching $115,700, the price pulled back as expected, dropping to $112,600. Now, BTC is showing renewed demand and is currently trading around $114,200. If the price manages to hold above the key $112,000–$113,300 support zone, we can expect further upside…
Read more

XAUUSD GOLD EURUSD GBPUSD Forex Gold Master Arman Shaban

Gold Analysis – 06.Aug.2025

Gold Analysis: By analyzing the gold chart on the 4-hour timeframe, we can see that after our previous analysis, gold began to rise and successfully hit all three targets — $3367, $3375, and $3385 — delivering over 230 pips in returns! After reaching $3390, it faced some selling pressure and is currently trading around $3380. Now,…
Read more

Crypto Blockchain Bitcoin Ethereum Gold Master Arman Shaban

Ethereum Analysis – 05.Aug.2025

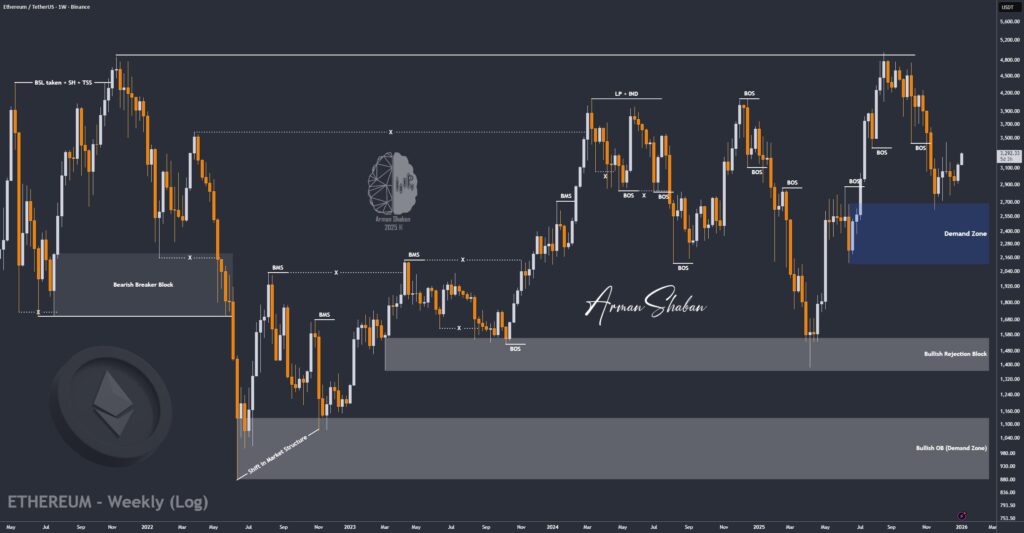
Ethereum Analysis: By analyzing the Ethereum chart on the weekly timeframe, we can see that after pulling back to $3350, ETH managed to climb back above $3500 and is now trading around $3650. If the price maintains its current momentum, we could see another bullish wave pushing it above the $4000 mark. However, this move depends…
Read more

Crypto Blockchain Bitcoin Ethereum Gold Master Arman Shaban

TonCoin Analysis – 05.Aug.2025

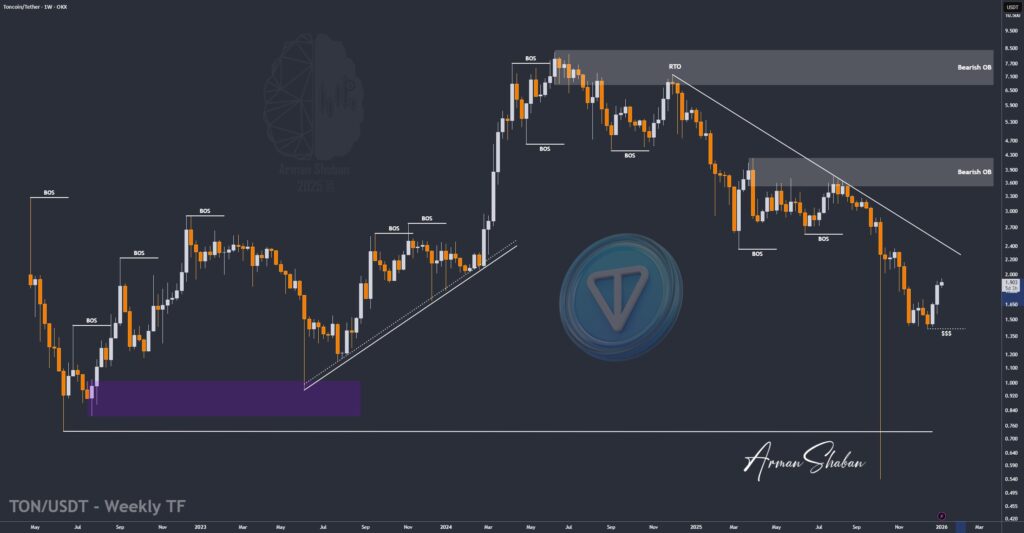
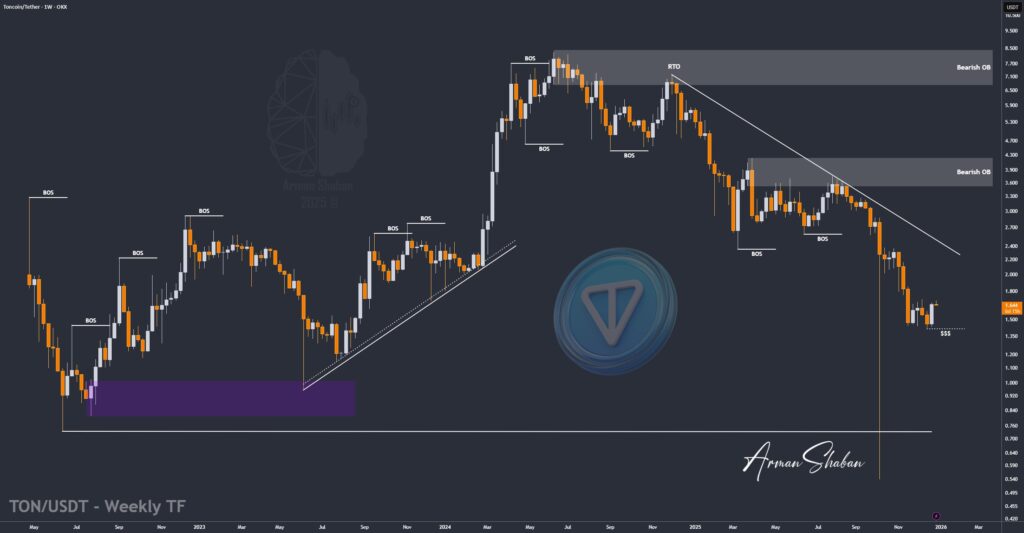
TonCoin Analysis: By analyzing the Toncoin chart on the 3-day timeframe, we can see that after reaching $3.73, the price has entered a correction phase and is currently trading around $3.30. We should soon watch for a potential bullish reaction from the $3.03–$3.30 zone. If the next upward move begins, the bullish targets will be $3.74,…
Read more

XAUUSD GOLD EURUSD GBPUSD Forex Gold Master Arman Shaban

Gold Analysis – 05.Aug.2025

Gold Analysis: By analyzing the gold chart on the 4-hour timeframe, we can see that after hitting the first target at $3361, gold continued its rally and reached our second supply level at $3385. Upon reaching this key level, the price faced strong selling pressure, dropping over 350 pips down to $3349. Gold is now trading…
Read more

Crypto Blockchain Bitcoin Ethereum Gold Master Arman Shaban

Bitcoin Analysis – 04.Aug.2025

Bitcoin Analysis: By analyzing the Bitcoin chart on the 4-hour timeframe, we can see that, just as expected, the price entered the $112,000 demand zone and reacted strongly, climbing to $115,000. Currently, Bitcoin is trading around $114,500, and if it manages to break above the $116,000 resistance, there’s a high probability it will continue toward $117,700.…
Read more

XAUUSD GOLD EURUSD GBPUSD Forex Gold Master Arman Shaban

Gold Analysis – 04.Aug.2025

Gold Analysis: By analyzing the gold chart on the 4-hour timeframe, we can see that, as expected from the previous analysis, gold resumed its upward move after a brief correction and reached the first key supply level at $3371. Upon touching this level, the price reacted with a pullback and is now trading around $3367, delivering…
Read more

Crypto Blockchain Bitcoin Ethereum Gold Master Arman Shaban

Solana Analysis – 03.Aug.2025

Solana Analysis: By analyzing the Solana chart on the daily timeframe, we can see that, like the rest of the market, it’s undergoing a correction dropping over 25% from the $206 area so far. Solana is now approaching a highly attractive buy zone between $136–$148, so be sure to closely monitor the price reaction in this…
Read more

Crypto Blockchain Bitcoin Ethereum Gold Master Arman Shaban

Cardano Analysis – 03.Aug.2025

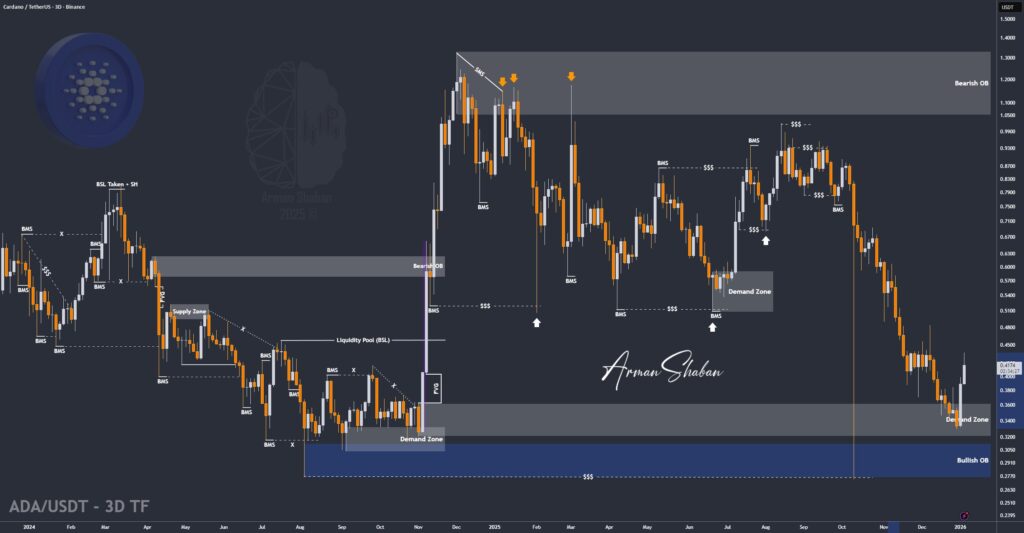
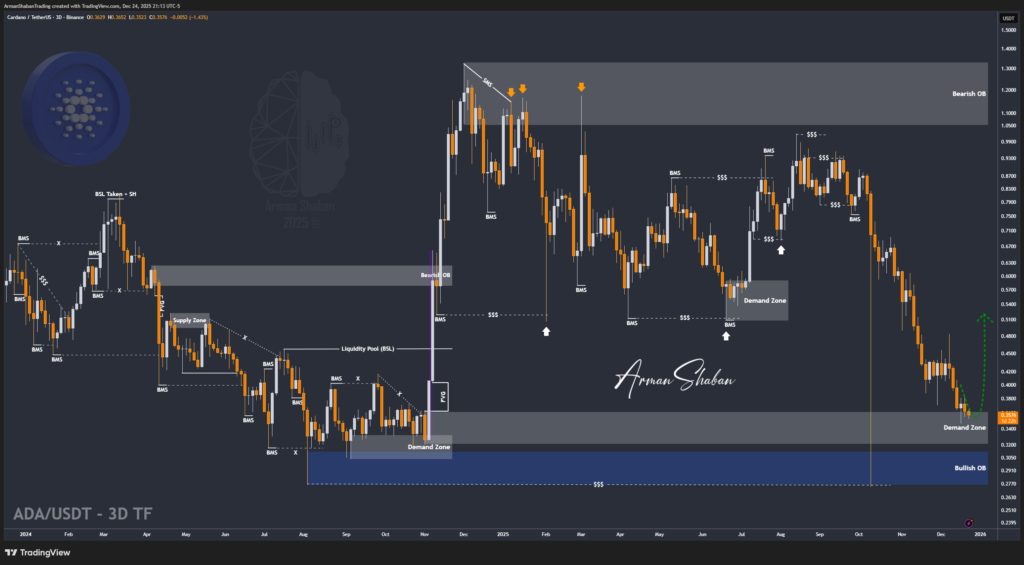
Cardano Analysis: By analyzing the #Cardano chart on the 3-day timeframe, we can see that the price has broken below the $0.69 support and is currently trading around $0.68. If ADA fails to reclaim $0.75 by tomorrow, we could see further downside, with $0.61 as the next likely target. This analysis will be updated soon stay…
Read more

Crypto Blockchain Bitcoin Ethereum Gold Master Arman Shaban

Bitcoin Analysis – 03.Aug.2025

Bitcoin Analysis: By analyzing the Bitcoin chart on the 4-hour timeframe, we can see that after reaching a new high at $123,218, the price began to pull back and has now corrected down to around $112,500. I expect the current volatility to ease soon. The next critical support zone lies between $110,500–$112,000 — watch price action…
Read more