Gold Analysis – 1.Jul.2026
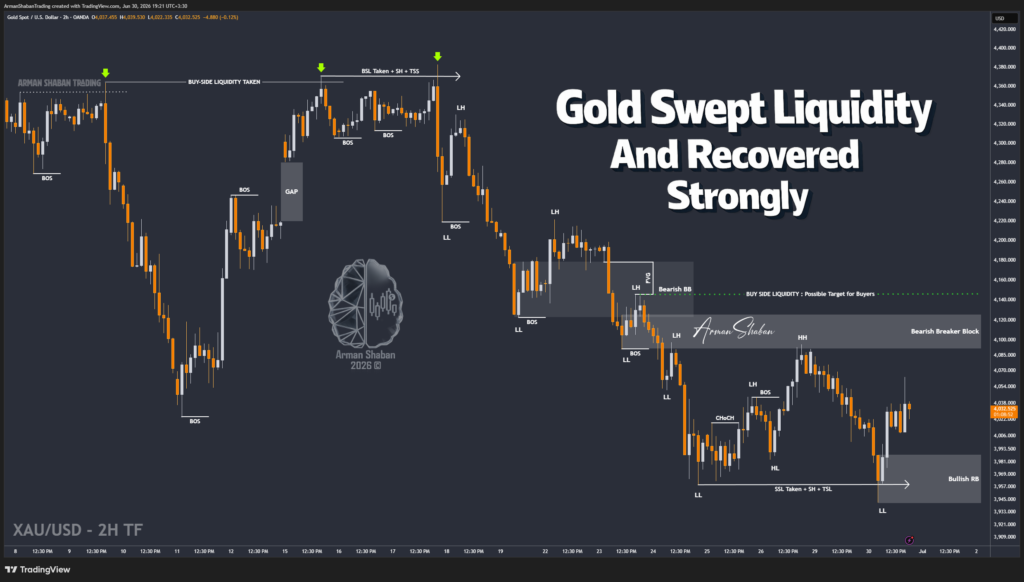
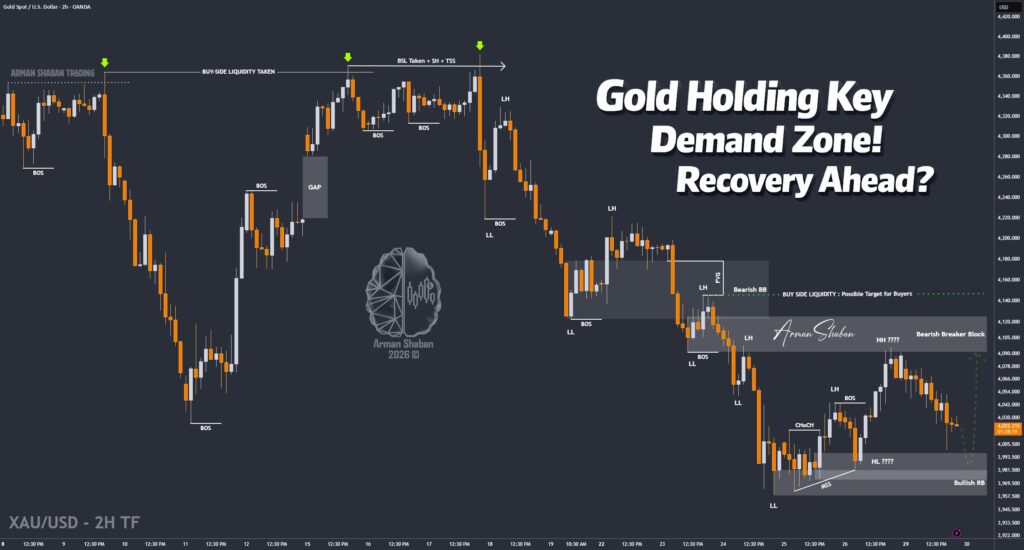
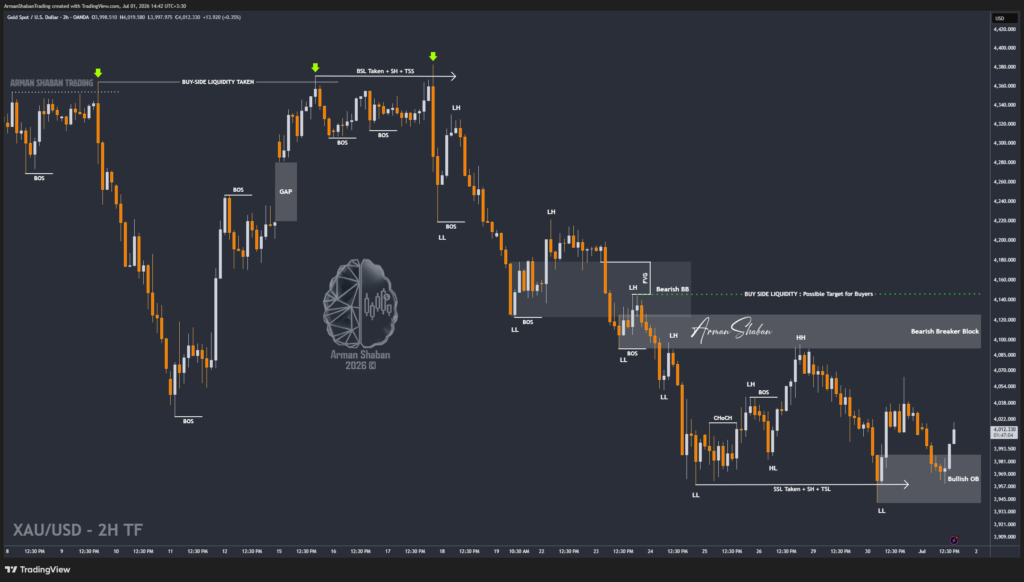
Gold Analysis: By analyzing the #Gold chart on the 2H timeframe, we can see that after the previous analysis, Gold first entered a deeper corrective move and revisited the Bullish OB marked on the chart. Price corrected toward the $3960 region before buyers stepped in once again and pushed Gold back toward the $4008 area. Currently,…
Read more