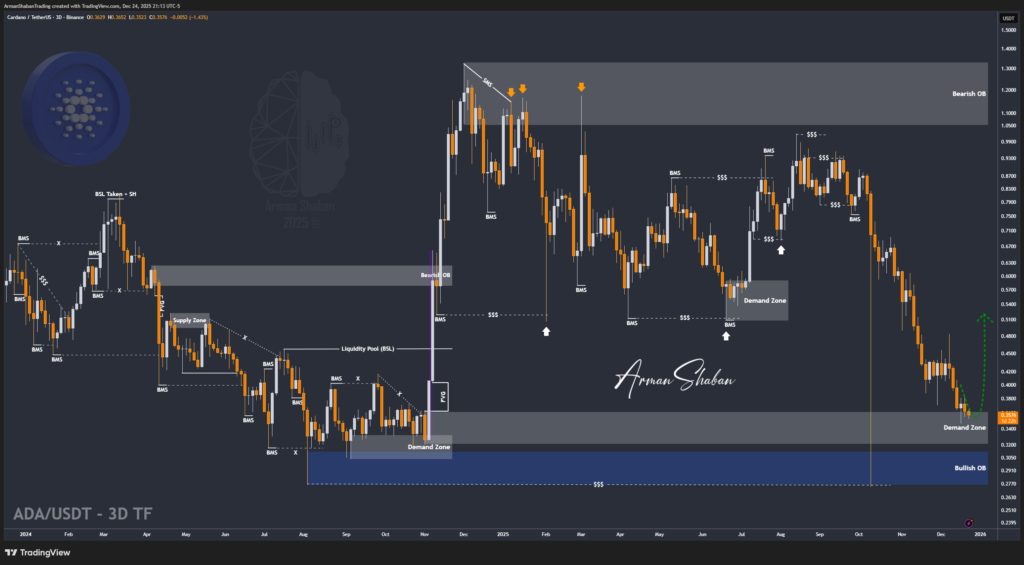
Cardano Analysis – 06.Jan.2026
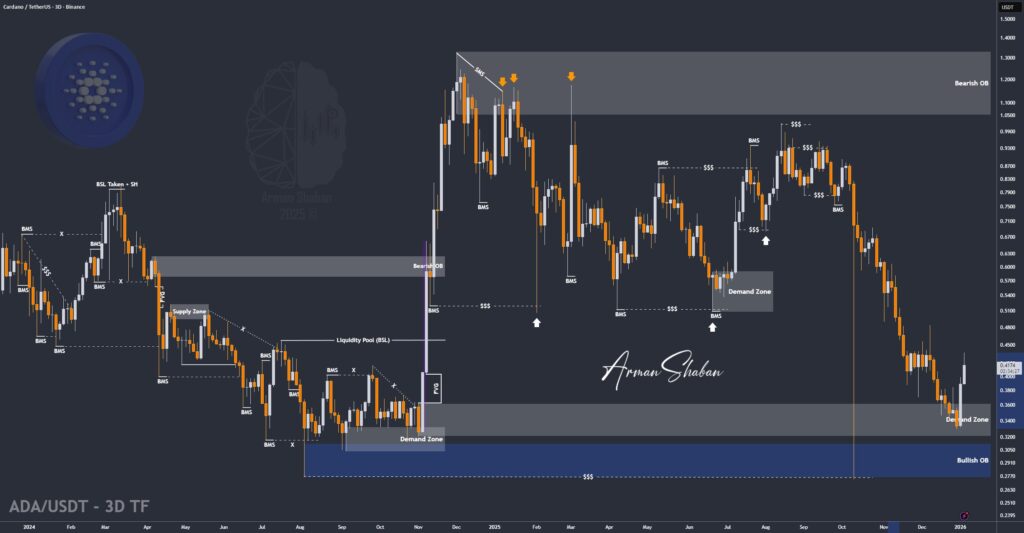
Cardano Analysis: $ADA dropped into the $0.32–$0.36 demand zone exactly as forecasted. Once it hit the zone, strong buying pressure kicked in, launching the price above $0.43 and delivering a sharp 33% rally. The main analysis remains valid. As long as price holds above $0.38–$0.40, new bullish targets are $0.46, $0.50, and potentially $0.54.(This Post on TradingView) Author : Arman ShabanTo…
Read more