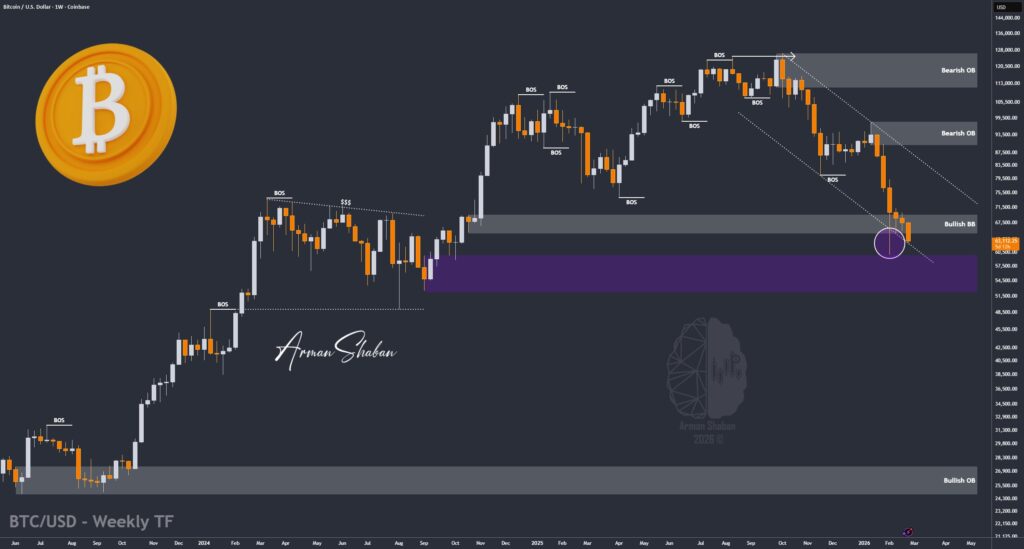
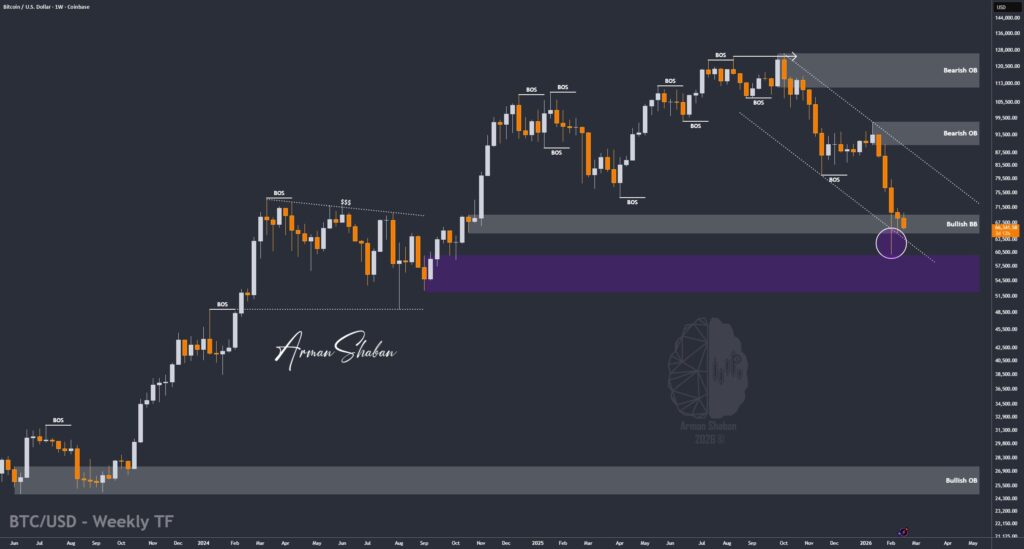
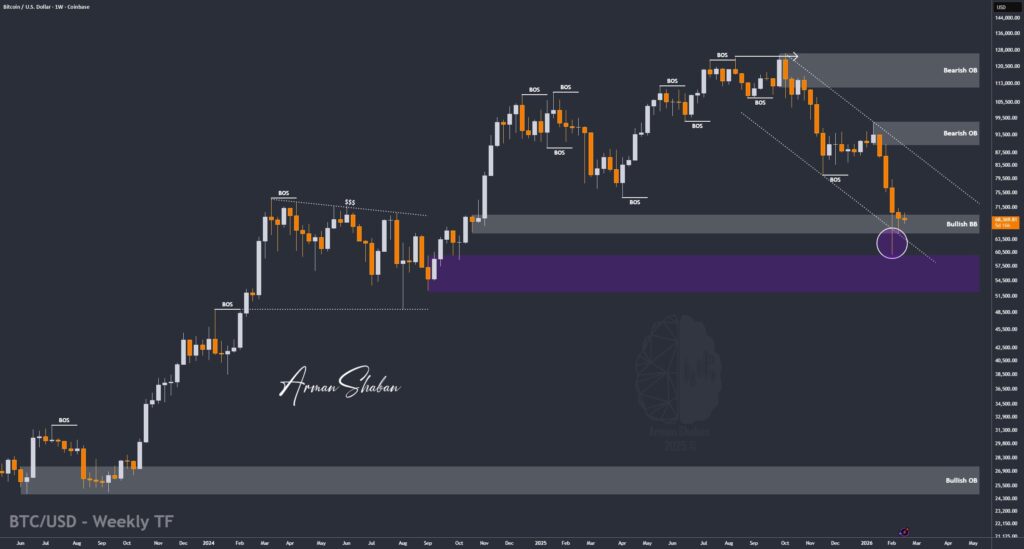
me@armanshaban.com

Tag: Bitcoin

Crypto Blockchain Bitcoin Ethereum Gold Master Arman Shaban

Bitcoin Analysis – 18.Oct.2025

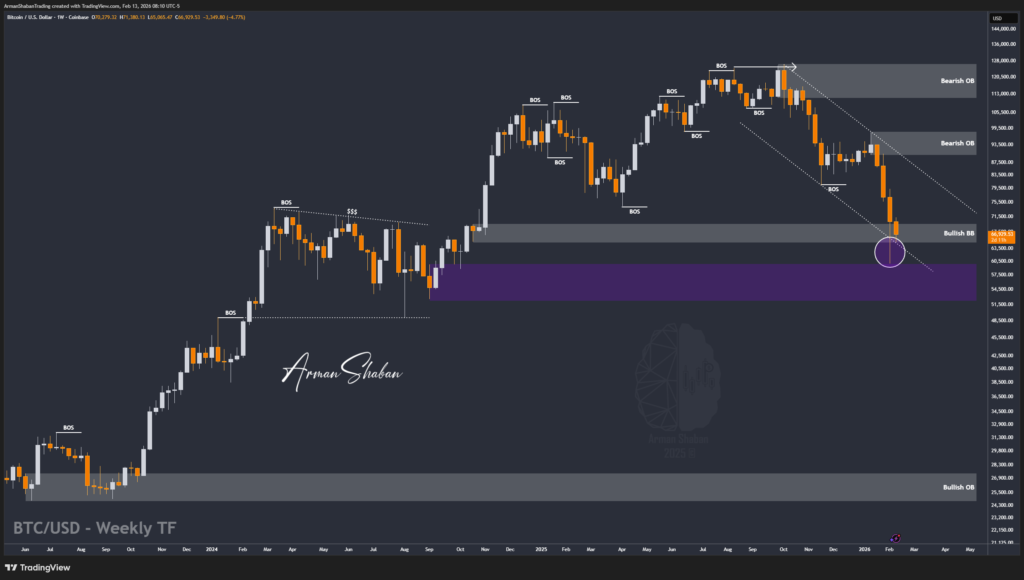
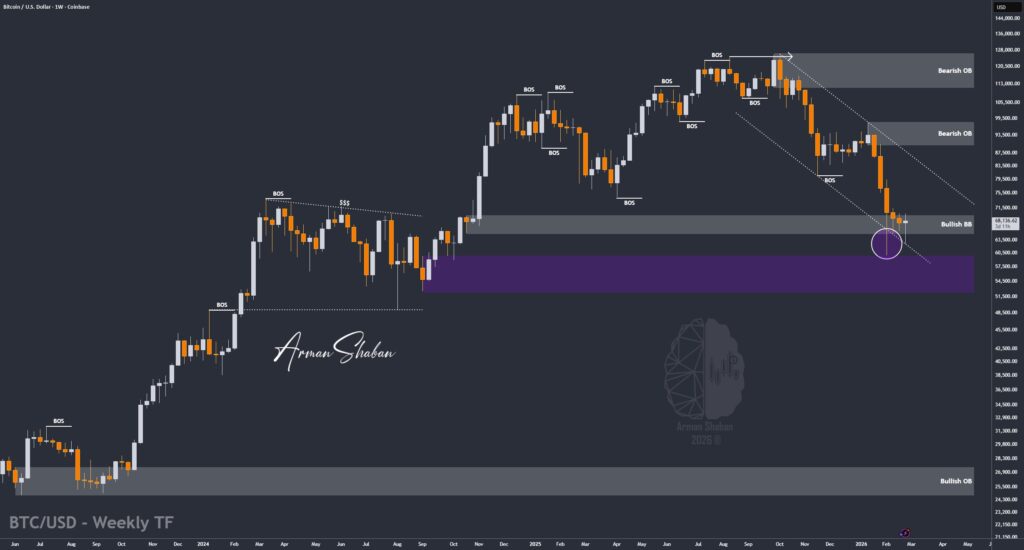
Bitcoin Analysis: By analyzing the #Bitcoin (BTC) chart on the 12-hour timeframe, we can see that BTC failed to sustain above the $110K level and faced a sharp sell-off, dropping to around $103,500. However, strong buying pressure quickly stepped in, driving the price back up toward $107,300. This reaction confirms that the $103K–$105K zone is still…
Read more

Crypto Blockchain Bitcoin Ethereum Gold Master Arman Shaban

Litecoin Analysis – 18.Oct.2025

Litecoin Analysis: By analyzing the #Litecoin (LTC) chart on the weekly timeframe, we can see that after the recent market-wide correction, LTC dropped to around $83, perfectly testing the $76–$88 demand zone highlighted in the previous analysis.As expected, this area attracted strong buying pressure, pushing the price back up toward $91, confirming that buyers continue to…
Read more

Crypto Blockchain Bitcoin Ethereum Gold Master Arman Shaban

Bitcoin Analysis – 11.Oct.2025

Bitcoin Analysis: : By analyzing the #Bitcoin (BTC) chart on the 12-hour timeframe, we can see that last night, following Trump’s tweet, the market faced a sharp sell-off, with BTC dropping all the way down to $102,000. After hitting this key demand zone, Bitcoin bounced back strongly, rallying up to $115,000, and is now trading around…
Read more

Crypto Blockchain Bitcoin Ethereum Gold Master Arman Shaban

Cardano Analysis – 11.Oct.2025

Cardano Analysis: By analyzing the #Cardano (ADA) chart on the 3-day timeframe, we can see that, like the rest of the market — or even more severely — ADA faced a massive dump of over 65%, dropping below $0.275. After a liquidity grab under that level, strong buying pressure emerged, driving the price up by 130%,…
Read more

Crypto Blockchain Bitcoin Ethereum Gold Master Arman Shaban

Litecoin Analysis – 11.Oct.2025

Litecoin Analysis: By analyzing the #Litecoin (LTC) chart on the weekly (logarithmic) timeframe, we can see that after the previous analysis, the price experienced a sharp dump of over 60%, dropping all the way to $52. Once it reached this key demand zone, strong buying pressure emerged, pushing the price up by 75% to $93.3. As…
Read more

Crypto Blockchain Bitcoin Ethereum Gold Master Arman Shaban

Bitcoin Analysis – 10.Oct.2025

Bitcoin Analysis: By analyzing the Bitcoin (BTC) chart on the 4-hour timeframe, we can see that after rallying up to $126,000 and setting a new all-time high (ATH), the price faced a sharp correction and is now trading around $119,000. This drop could extend further toward $117,000, which is a key level to watch closely. If…
Read more

Crypto Blockchain Bitcoin Ethereum Gold Master Arman Shaban

Litecoin Analysis – 10.Oct.2025

Litecoin Analysis: By analyzing the #Litecoin (LTC) chart on the weekly (logarithmic) timeframe, we can see that the price started rising from around $115 after the last analysis and has now reached $133, marking a solid gain of over 30% so far! If the current momentum continues, we could see Litecoin moving even higher. The next…
Read more

Crypto Blockchain Bitcoin Ethereum Gold Master Arman Shaban

Aster Analysis – 06.Oct.2025

Aster Analysis: By analyzing the #Aster chart on the 2-hour timeframe, we can see that the price is currently trading around $2.08. Since its listing, this crypto has surged over 7000%, but later experienced a heavy drop. Now it’s consolidating within a key range — making it a high-risk, high-reward setup for early investors. The first…
Read more

Crypto Blockchain Bitcoin Ethereum Gold Master Arman Shaban

Cardano Analysis – 06.Oct.2025

Cardano Analysis: By analyzing the #Cardano (ADA) chart on the 3-day timeframe, we can see that the price has continued its strong upward move as expected and is now trading around $0.87, just a step away from hitting the next target at $0.95. The momentum remains strong, and I expect to see even more bullish movement…
Read more

Crypto Blockchain Bitcoin Ethereum Gold Master Arman Shaban

Ethereum Analysis – 03.Oct.2025

Ethereum Analysis: By analyzing the Ethereum chart on the weekly timeframe, we can see that after entering the $3,800 demand zone, ETH gained strong buying pressure and reached the $4,200 and $4,600 targets. Currently, Ethereum is trading around $4,500, up about 19%, and I expect further bullish movement soon. The next upside targets are $4,950, $5,500,…
Read more