Gold Analysis – 20.Feb.2026
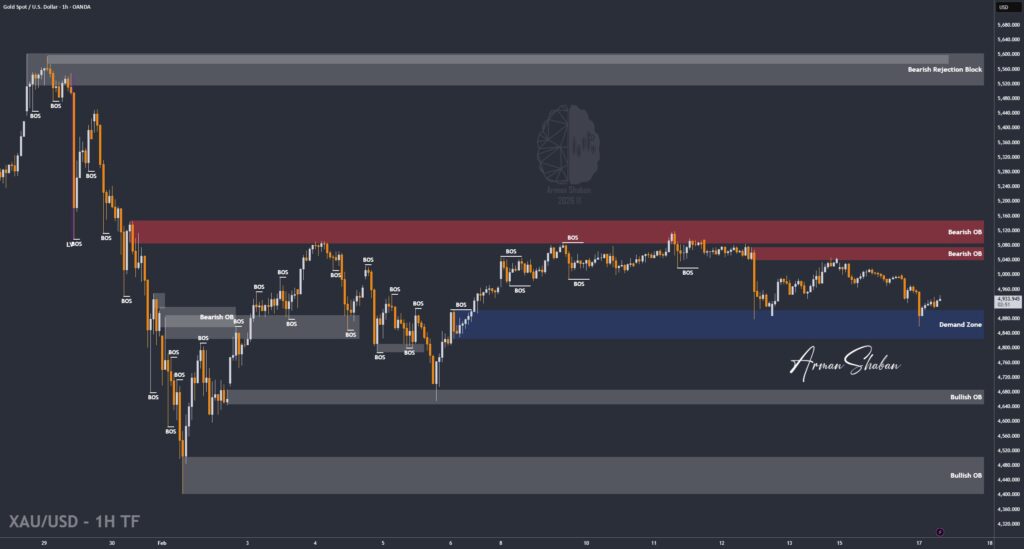
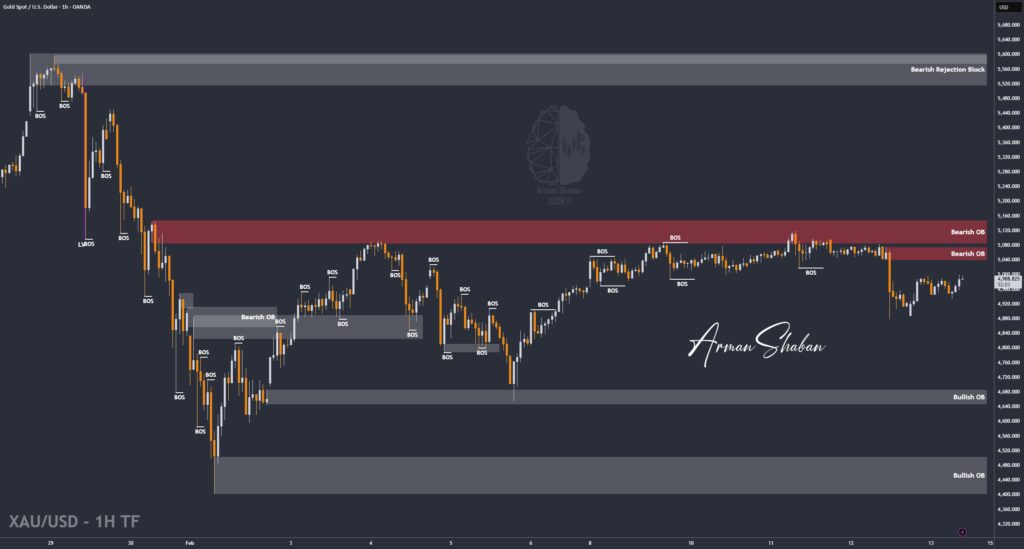
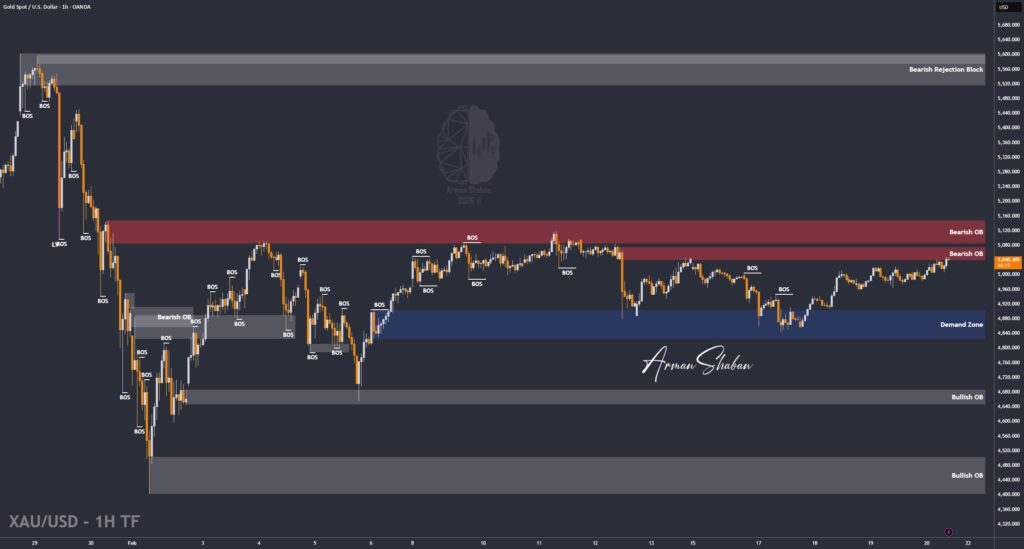
Gold Analysis: By analyzing the #Gold chart on the 1-hour timeframe, we can see that price reacted almost exactly as expected and respected nearly all the previously marked levels. The reactions from supply and demand zones were clean, structured, and technically precise. Gold pushed higher and reached the $5048 level, while also delivering multiple corrective moves…
Read more