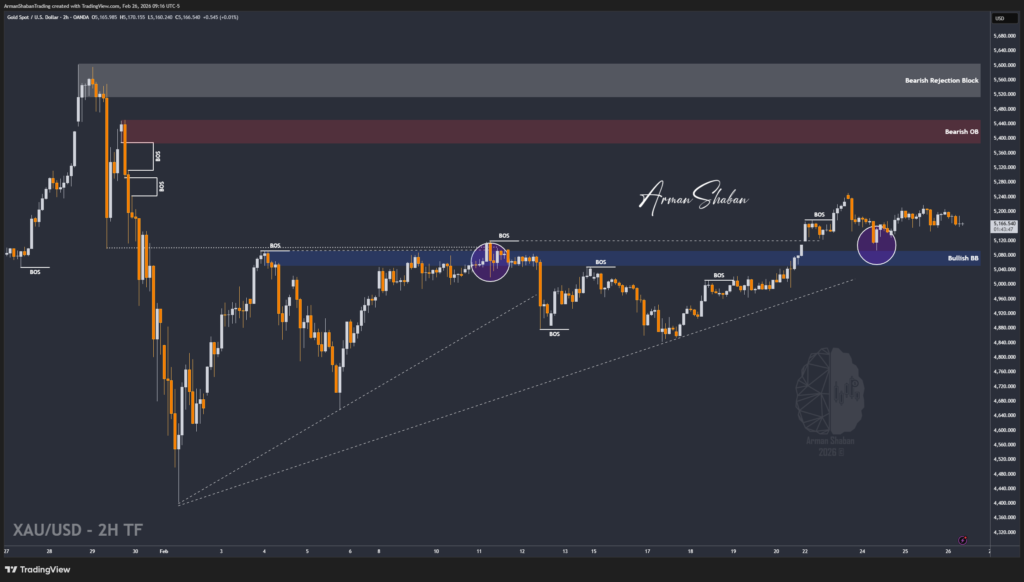
Gold Analysis – 27.Feb.2026
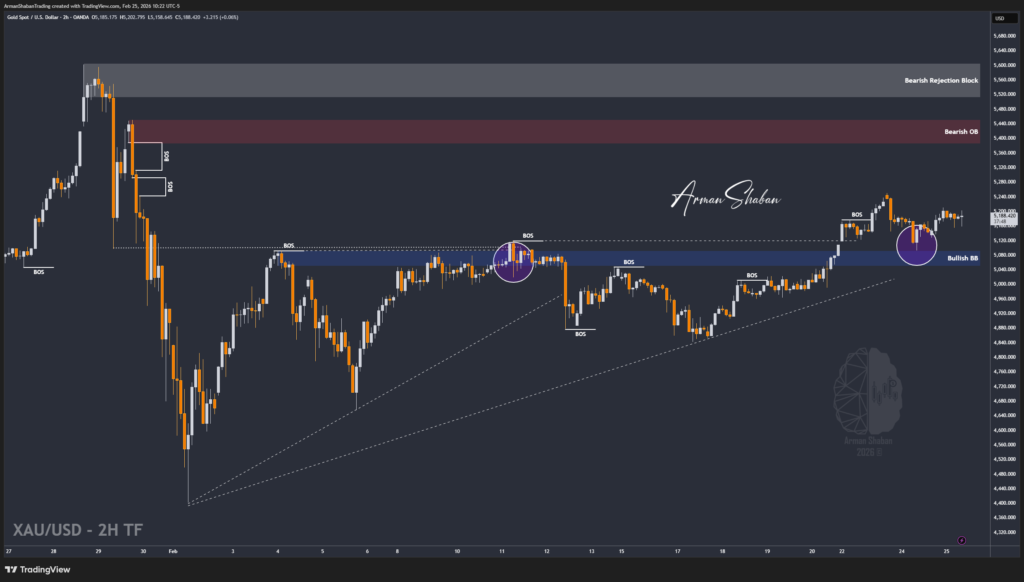
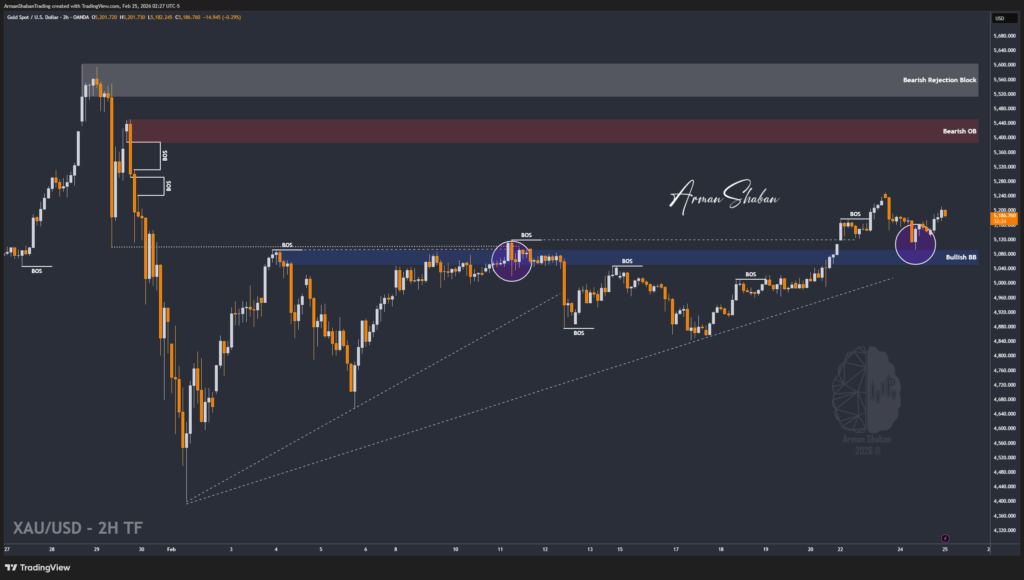
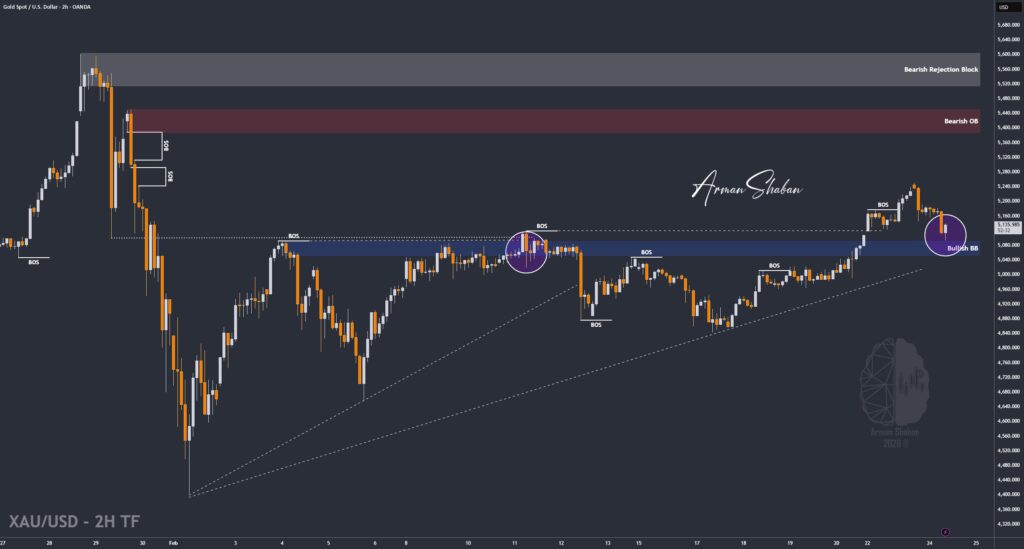
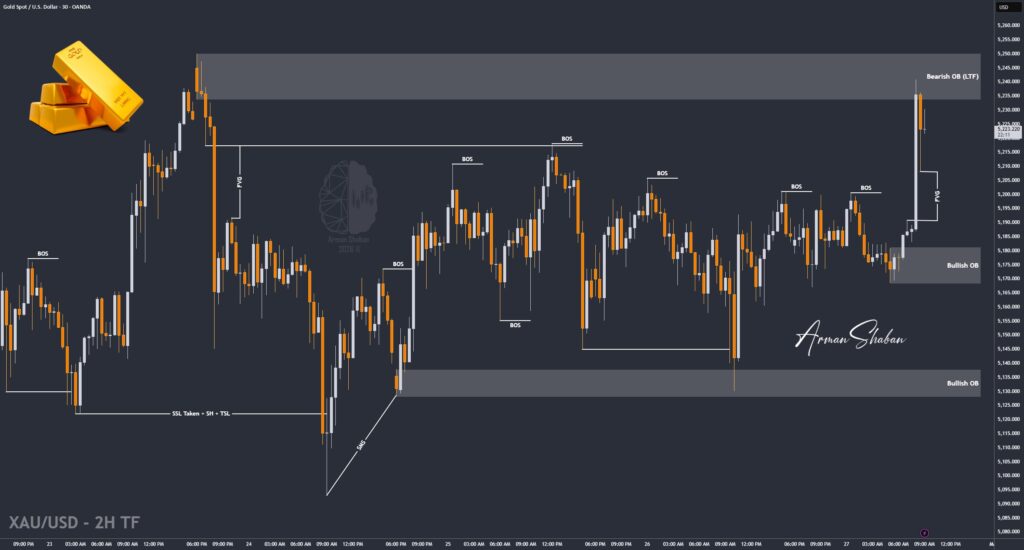
Gold Analysis: By analyzing the #Gold chart on the 2-hour timeframe, we can see that since yesterday price was ranging around the $5185 level without following a clear directional trend. However, today following new headlines and rising tension expectations, Gold experienced an aggressive impulsive move. Within minutes, price surged from around $5185 to $5240 and is…
Read more