Gold Analysis – 11.Sep.2024
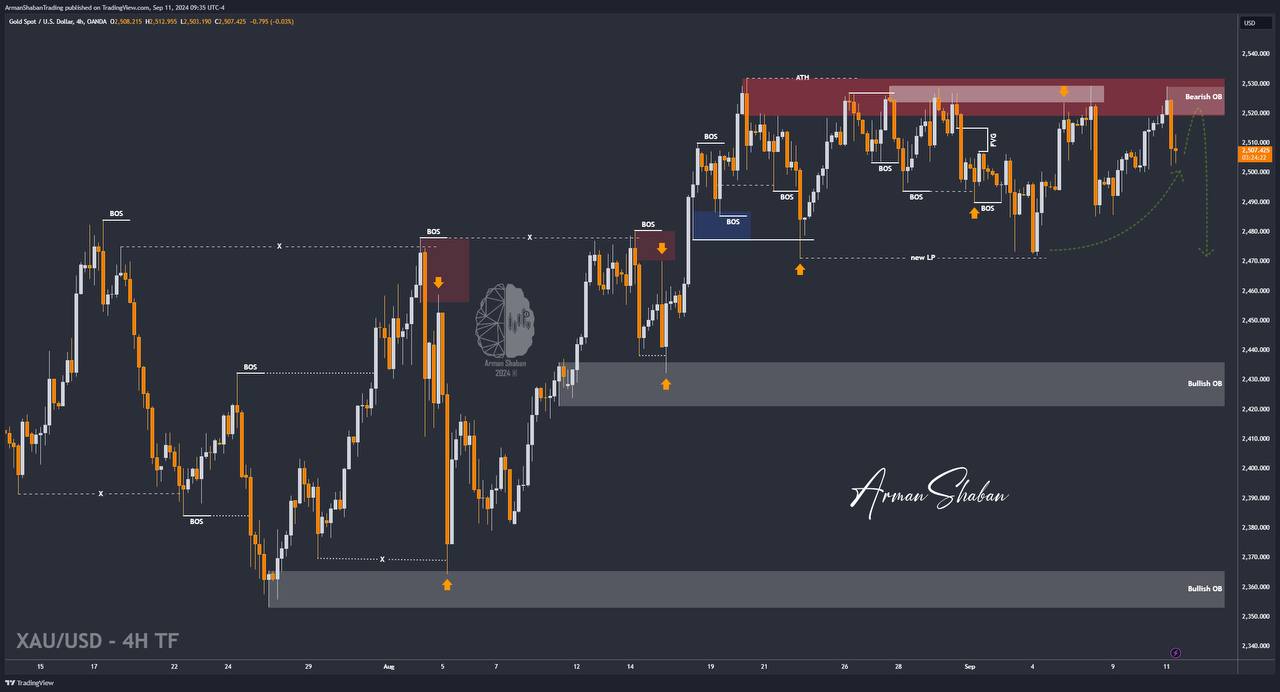
Gold Analysis: By analyzing the gold chart on the 4-hour timeframe, we can see that after finally filling the FVG in the $2507 to $2518 range yesterday, gold faced selling pressure and corrected down by 170 pips to $2501! After reaching $2501, the price found demand again and managed to rise to $2529 today. This is the seventh time in the last 17 days that the price has entered this crucial zone, and once again, it dropped from $2529 to $2502! Currently, gold is trading around $2505, and we may see further declines. The recent drop created a liquidity gap between $2512 and $2520, which I expect to be filled soon. Note that the resistance level at $2529 to $2532 has become very fragile, as the price has repeatedly reached and been rejected from this important zone. Therefore, I believe that in the mid-term, we can expect this resistance to be broken, leading to a potential rise in gold to $2550.
(This Post on TradingView)
Author : Arman Shaban
To see more analyzes of Gold , Forex Pairs , Cryptocurrencies , Indices and Stocks , be sure to Follow and Join us on other Platforms :
– Public Telegram Channel
– YouTube Channel
– TradingView
– X (Twitter)
– How to join our FOREX VIP Channel ?
– How to join our Crypto VIP Channel ?
– CONTACT ME directly on Telegram