Gold Analysis – 04.Sep.2024

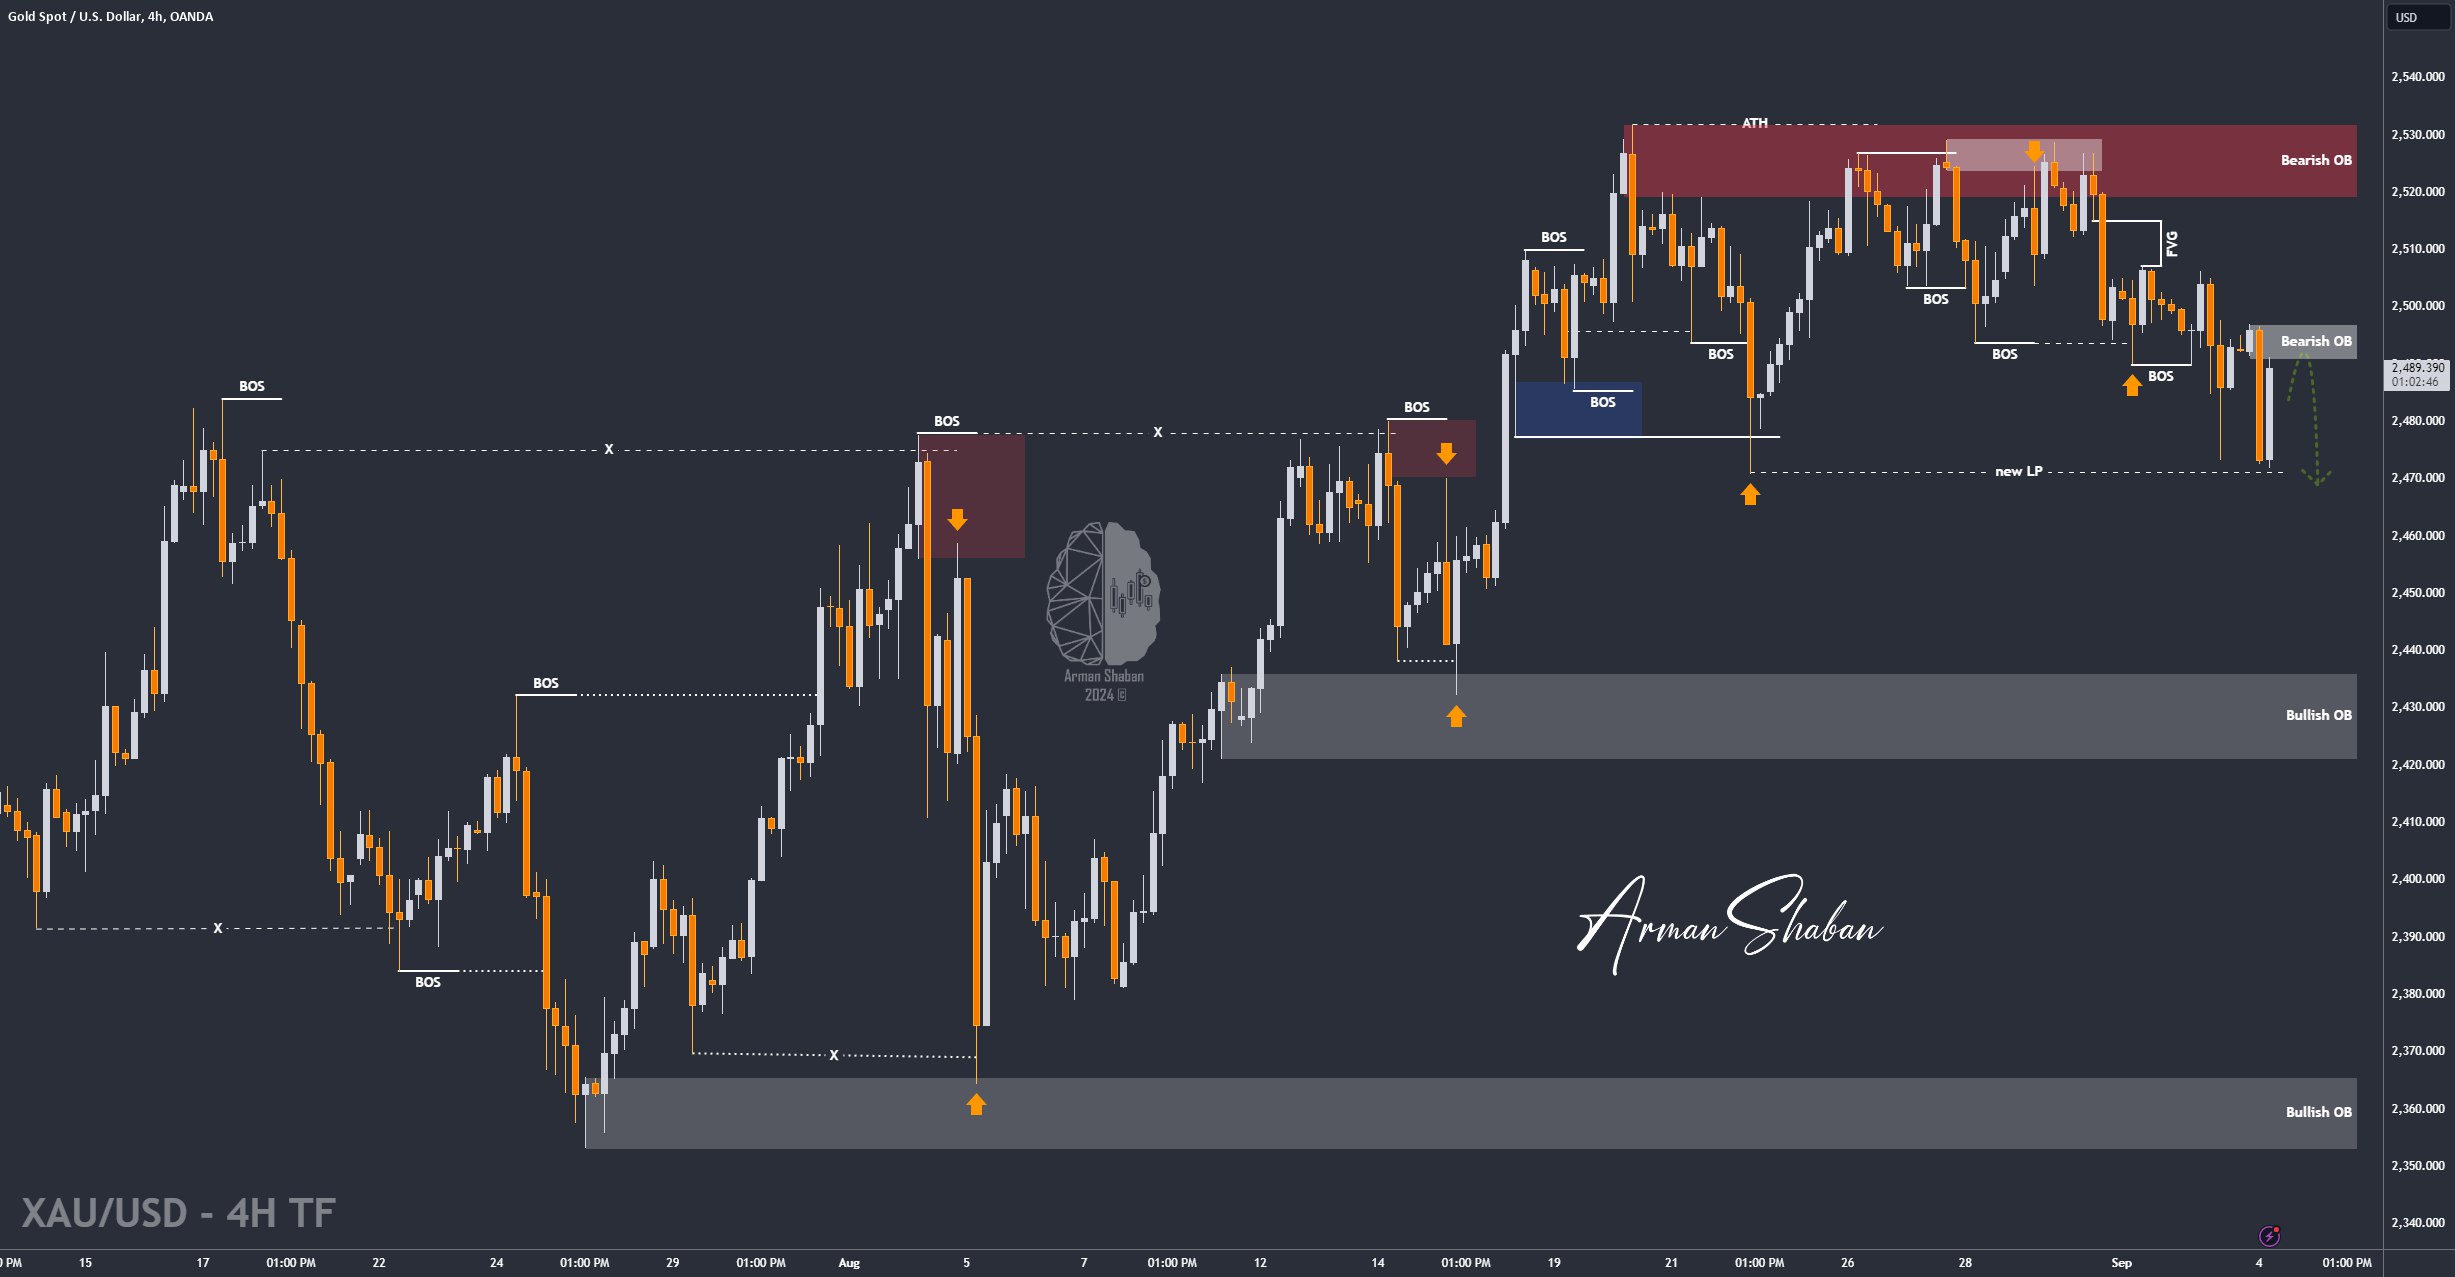
Gold Analysis: By analyzing the #Gold chart on the 4-hour timeframe, we can see that after last night’s analysis, gold rose again to $2497 before experiencing a sharp decline down to $2471. After reaching this critical level, the price didn’t penetrate the liquidity pool below $2471 and instead rebounded to $2491 to fill the liquidity gap caused by the previous drop. As you can see on the chart, the initial reaction to this level has been negative, and we need to see if gold can stabilize below $2491 with the upcoming market news. If it does, we can expect further declines towards lower targets. The potential targets are $2481, $2471.7, and $2460.5, respectively.
(This Post on TradingView)
Author : Arman Shaban
To see more analyzes of Gold , Forex Pairs , Cryptocurrencies , Indices and Stocks , be sure to Follow and Join us on other Platforms :
– Public Telegram Channel
– YouTube Channel
– TradingView
– X (Twitter)
– How to join our FOREX VIP Channel ?
– How to join our Crypto VIP Channel ?
– CONTACT ME directly on Telegram