EUR/USD Analysis – 18.Dec.2025
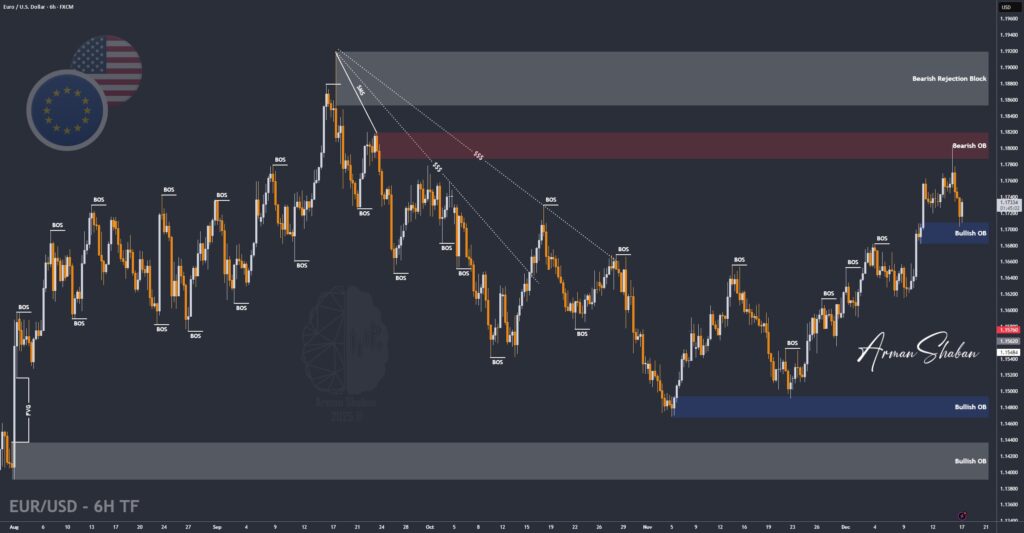
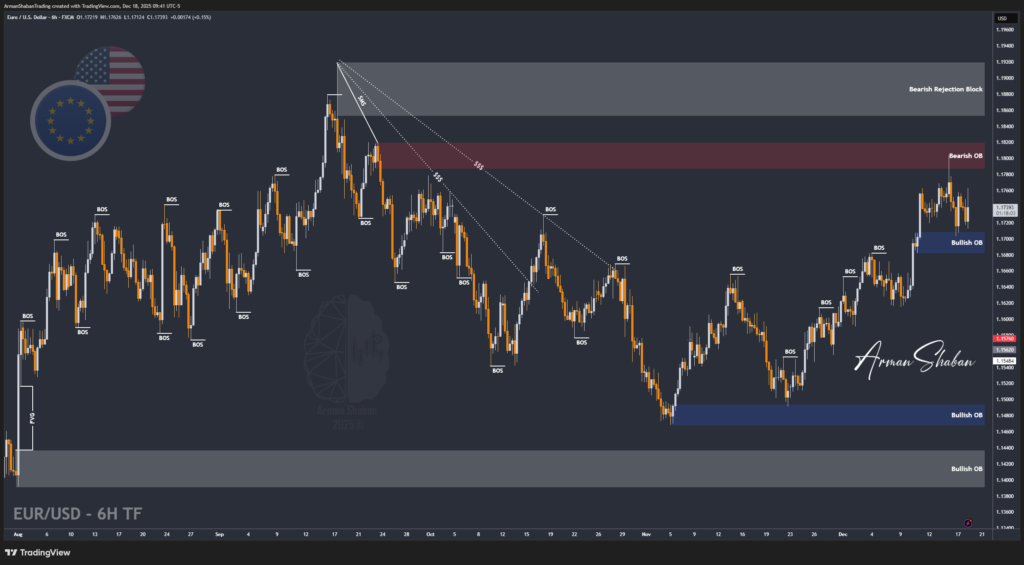
EUR/USD Analysis: By analyzing the #EURUSD chart on the 6 hour timeframe, we can see that price moved exactly as expected and started to rise from the level we were watching. EURUSD is now trading around 1.17430, and if price can stay and stabilize above the 1.17 level, I expect further upside. The next potential bullish…
Read more