Gold Analysis – 02.Feb.2026
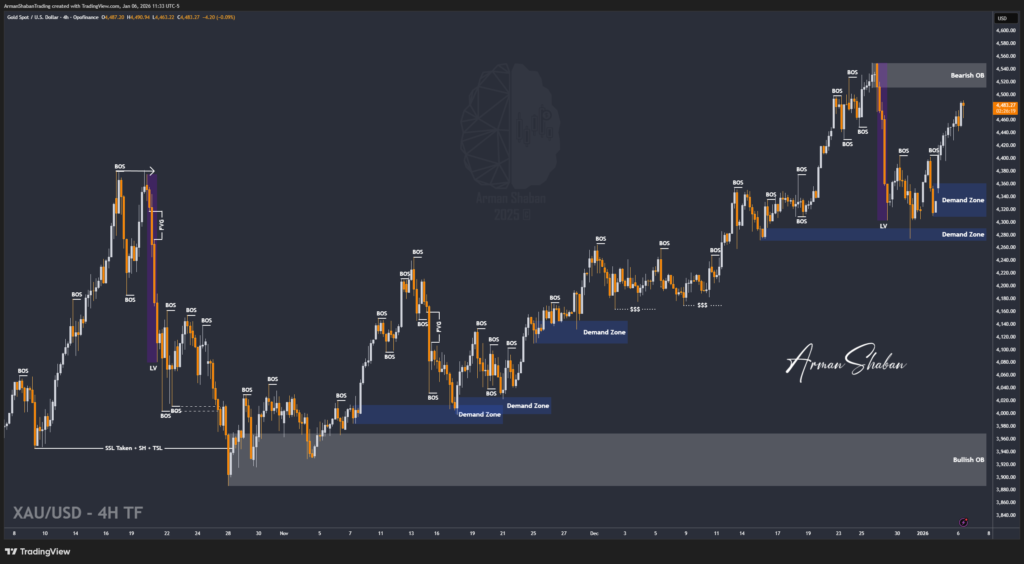
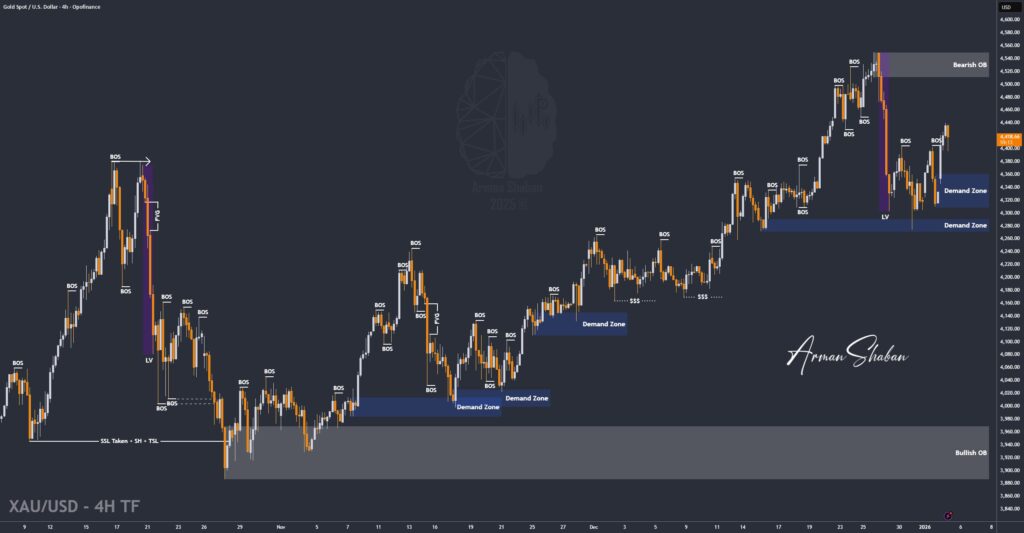
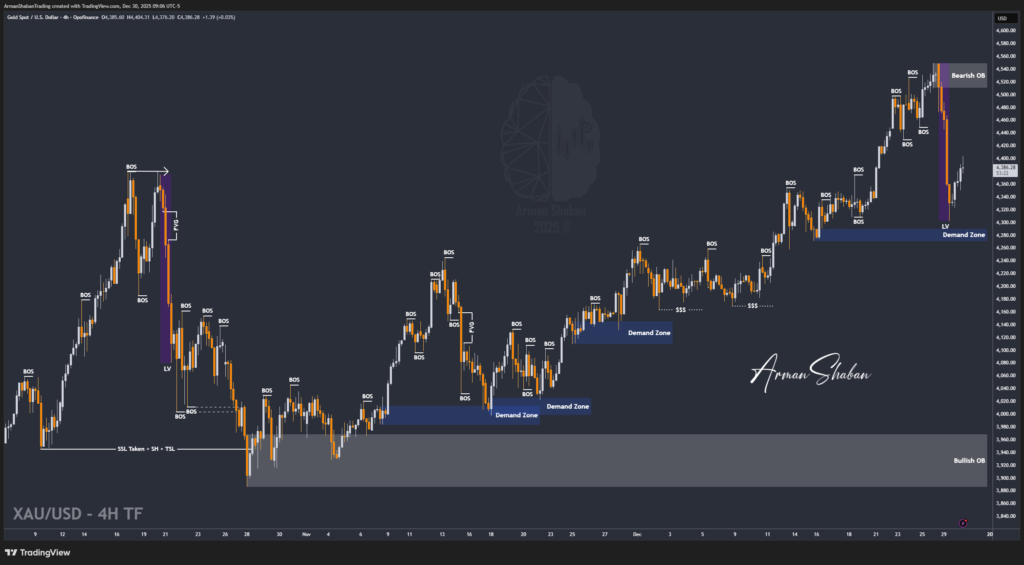
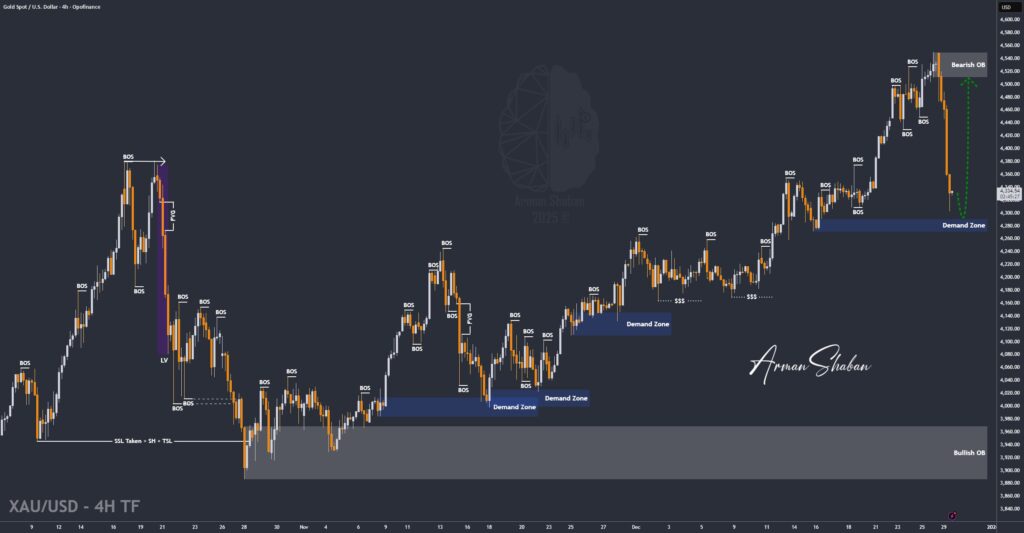
Gold Analysis: By analyzing the #Gold chart on the 4 hour timeframe, we can see that after a very strong rally, gold printed a historic high near $5600. Once price reached this level, it faced heavy selling pressure and experienced a massive historical drop of more than $1200, falling all the way to $4400, which equals…
Read more