me@armanshaban.com

Category: Technical Analysis

XAUUSD GOLD EURUSD GBPUSD Forex Gold Master Arman Shaban

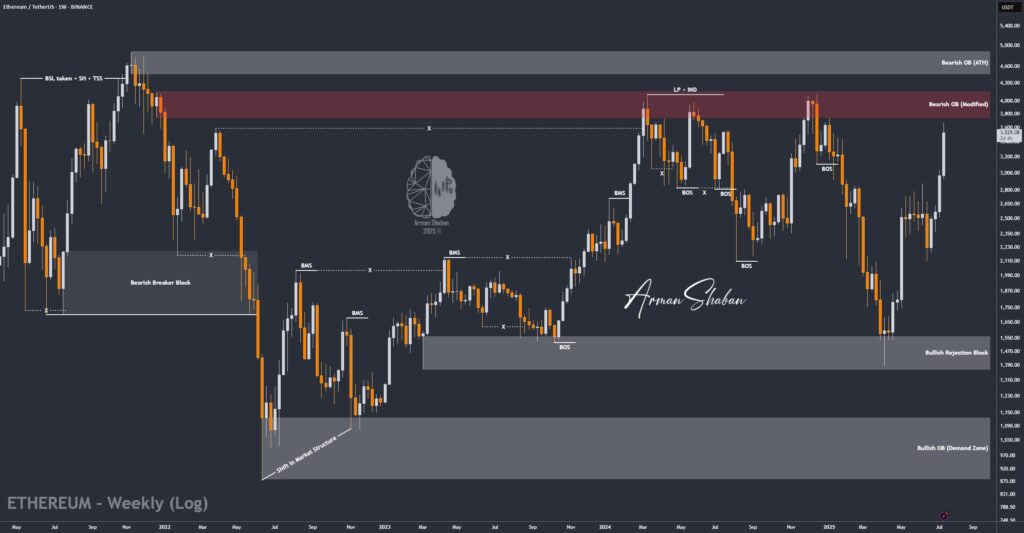
Ethereum Analysis – 21.May.2024

Ethereum Analysis: By examining the #Ethereum chart in the weekly timeframe (logarithmic), we observe that due to the likelihood of an upcoming Ethereum ETF approval, this cryptocurrency has experienced an attractive growth. From the previous analysis until now, it has achieved over a 30% increase, reaching $3,800! The next targets for Ethereum are, in order: $4,100,…
Read more

Crypto Blockchain Bitcoin Ethereum Gold Master Arman Shaban

Bitcoin Analysis – 21.May.2024

Bitcoin Analysis: Upon reviewing the latest #Bitcoin chart in the weekly timeframe (logarithmic), we observe that since the previous analysis, Bitcoin has successfully achieved more than a 15% increase, managing to penetrate above $70,000 once again! Considering the price movements and the momentum, I expect we will soon witness an explosive move from Bitcoin! This movement,…
Read more

XAUUSD GOLD EURUSD GBPUSD Forex Gold Master Arman Shaban

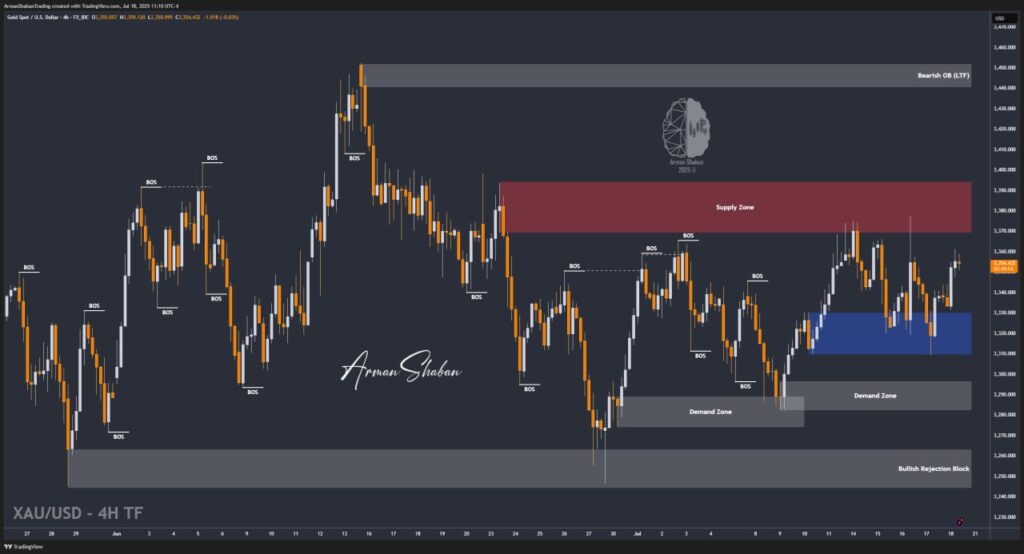
Gold Analysis – 21.May.2024

Gold Analysis: Upon reviewing the gold chart on a 15-minute timeframe, we observe that the price is currently trading around $2423. It is likely that in the initial movement, we will see an increase to the range of $2428.5 to $2433. Following that, once the price enters the specified range, we may witness another drop in…
Read more

XAUUSD GOLD EURUSD GBPUSD Forex Gold Master Arman Shaban

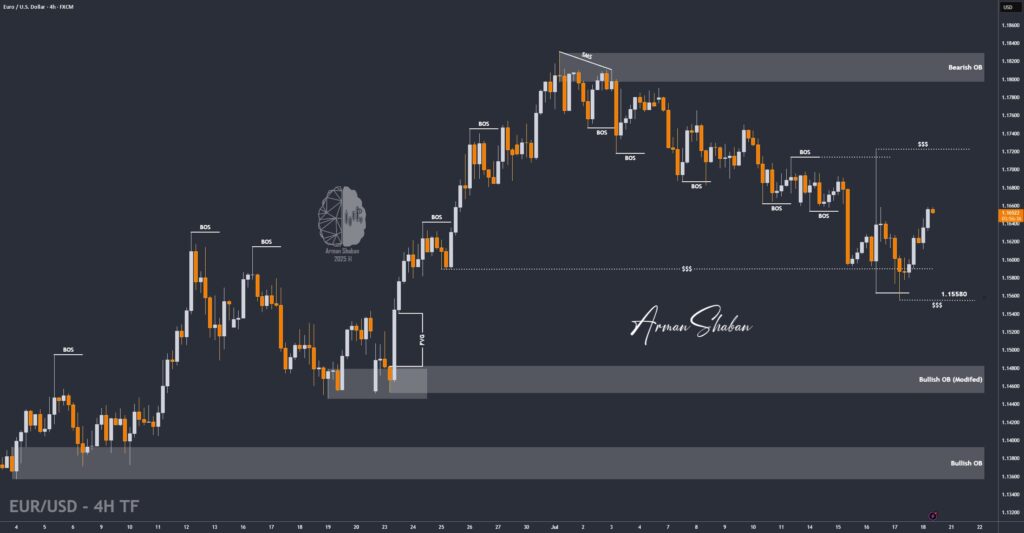
EUR/USD Analysis – 20.May.2024

EUR/USD Analysis: Upon reviewing the EUR/USD chart on the 4-hour timeframe, we observe that the price, after accumulating liquidity above 1.08860, underwent a correction. Currently, the price is re-entering the Bearish Order Block ahead and we are still witnessing an IMBALANCE or FVG prior to the specified order block. This fact significantly increases the importance of…
Read more

XAUUSD GOLD EURUSD GBPUSD Forex Gold Master Arman Shaban

Gold Analysis – 20.May.2024

Gold Analysis: By checking the gold chart in the weekly time frame, we see that today’s price was able to reach a new ATH of $2450 by conquering the previous peak! As you know, there was a liquidity pool above the previous ATH , and for this reason, the price has faced a slight correction after…
Read more

XAUUSD GOLD EURUSD GBPUSD Forex Gold Master Arman Shaban

Gold Analysis – 17.May.2024

Gold Analysis: Upon reviewing the gold chart in the 4-hour timeframe, we observe that the price, following our analysis, managed to rise by 170 pips to $2387. Since the range of $2386 to $2397 is an important supply zone, the price reaction to it was negative, and currently, gold is trading around $2383. If the price…
Read more

XAUUSD GOLD EURUSD GBPUSD Forex Gold Master Arman Shaban

Gold Analysis – 16.May.2024

Gold Analysis: Upon re-examining gold in the 4-hour timeframe, we observe that the price, after an initial drop, has once again encountered demand pressure and is currently trading with an increase of over 100 pips in the range of $2382! The other assumptions of the previous analysis remain valid!(This Post on TradingView) Author : Arman ShabanTo see more analyzes of Gold…
Read more

XAUUSD GOLD EURUSD GBPUSD Forex Gold Master Arman Shaban

Gold Analysis – 16.May.2024

Gold Analysis: As you can see, yesterday gold experienced a further decline and corrected to $2352. After that, it encountered demand pressure and managed to grow to $2397! As I mentioned in the previous analysis, the range of $2389 to $2399 was an important supply zone, and the price showed a negative reaction after reaching this…
Read more

XAUUSD GOLD EURUSD GBPUSD Forex Gold Master Arman Shaban

Gold Analysis – 15.May.2024

Gold Analysis: By analyzing the gold chart in the 2-hour timeframe, we observe that after the price drop to $2332, there was a demand surge, allowing the price to rise to higher levels as expected. After the price entered the Bearish BB zone at $2372, we saw a price drop to $2368. Currently, the price is…
Read more

XAUUSD GOLD EURUSD GBPUSD Forex Gold Master Arman Shaban

NASDAQ Analysis – 13.May.2024

NASDAQ Analysis: After examining the NASDAQ chart on a 4-hour timeframe, we observe that the price, after an initial correction from the 18250 area, has re-entered this zone and shown a negative reaction! As I mentioned in the previous analysis, the range from 18250 to 18340 is a very important supply area, and I expect the…
Read more