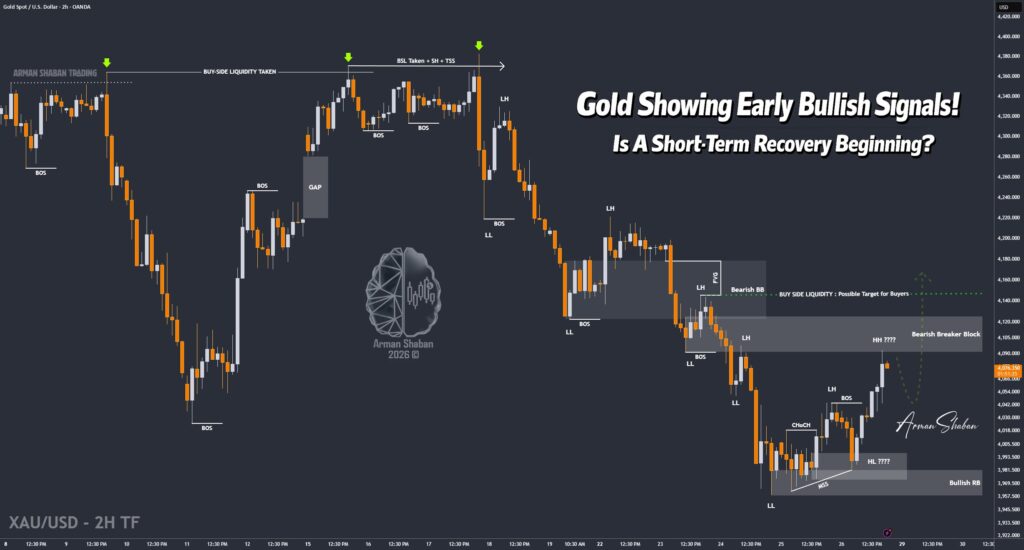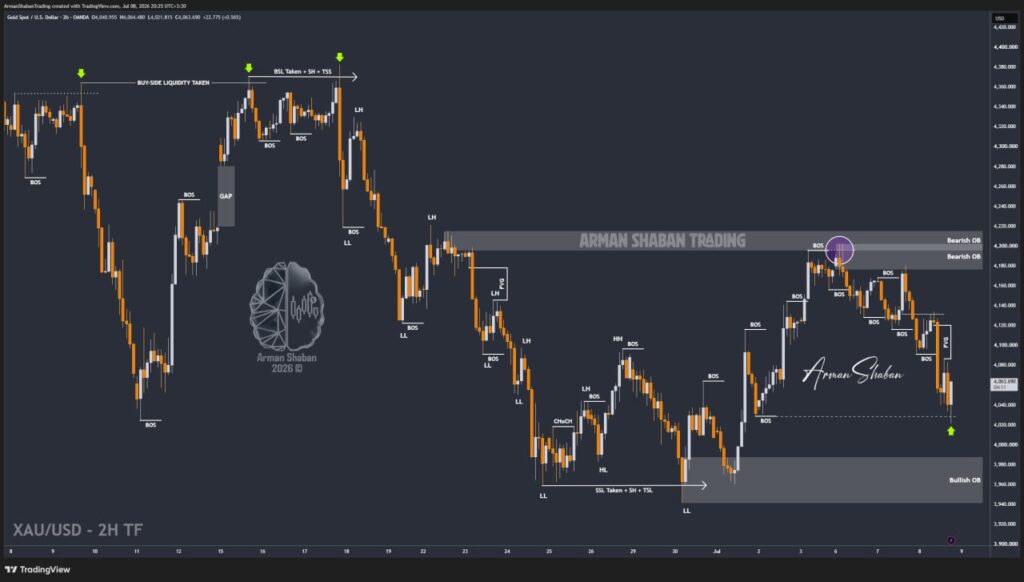
Gold Analysis – 08.Jul.2026
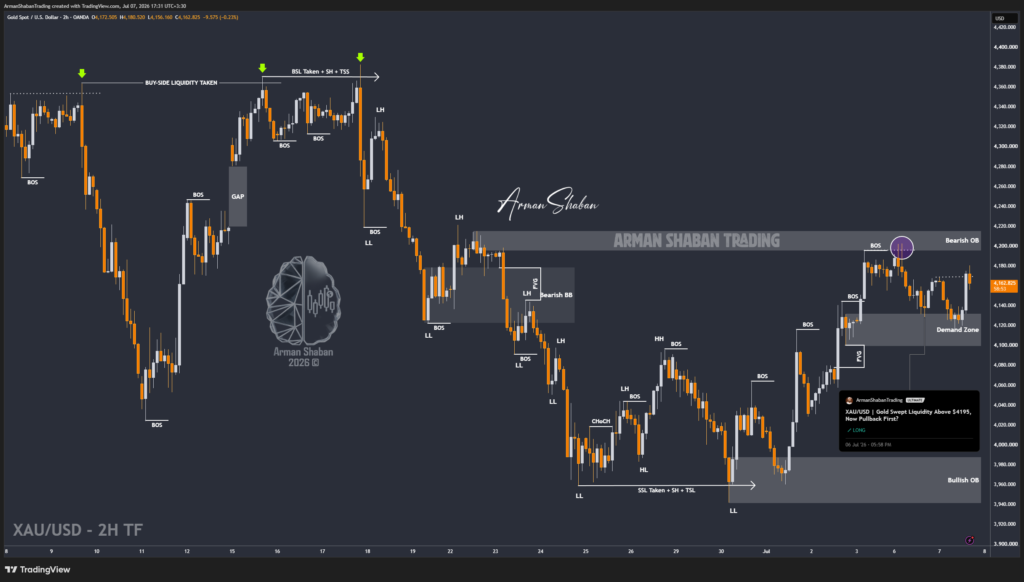
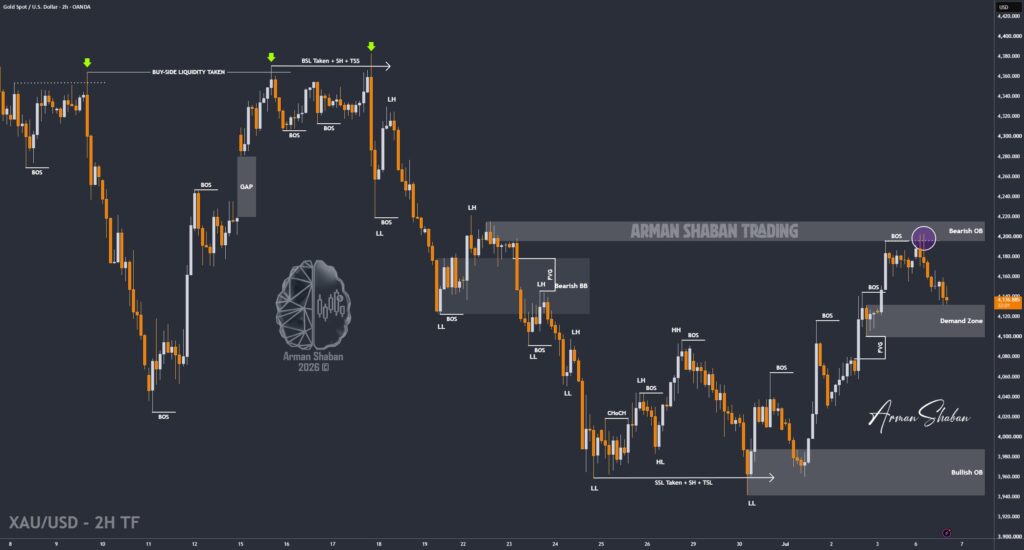
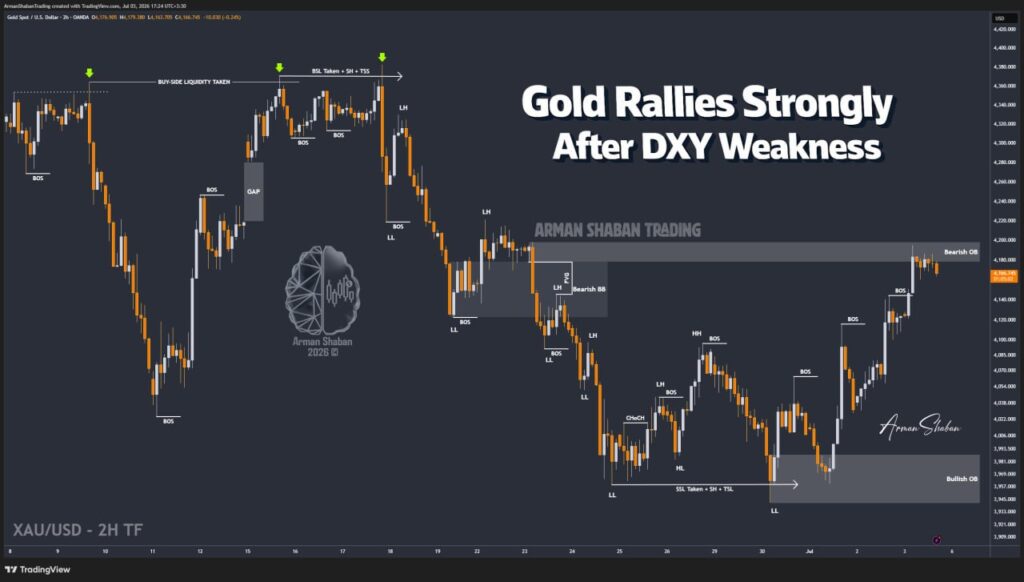
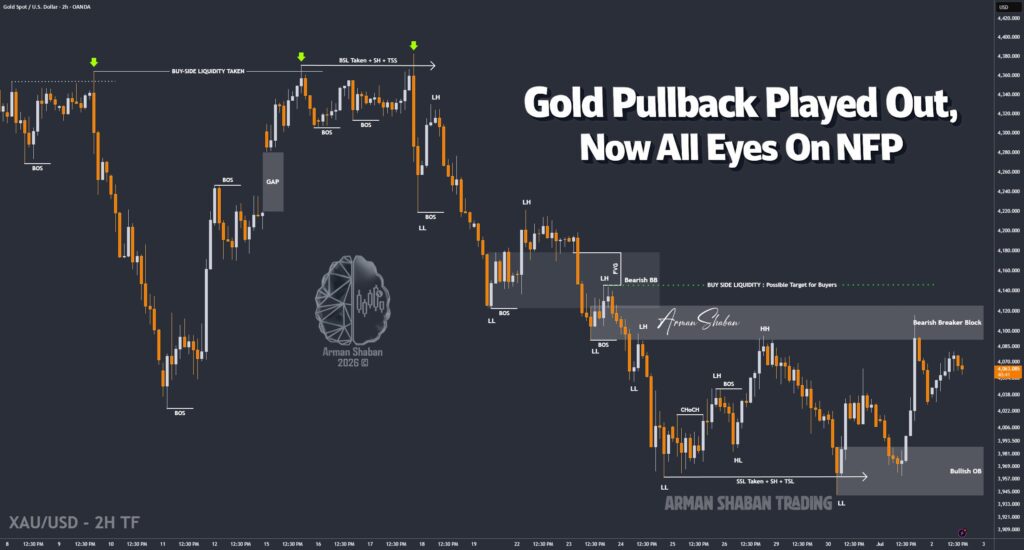
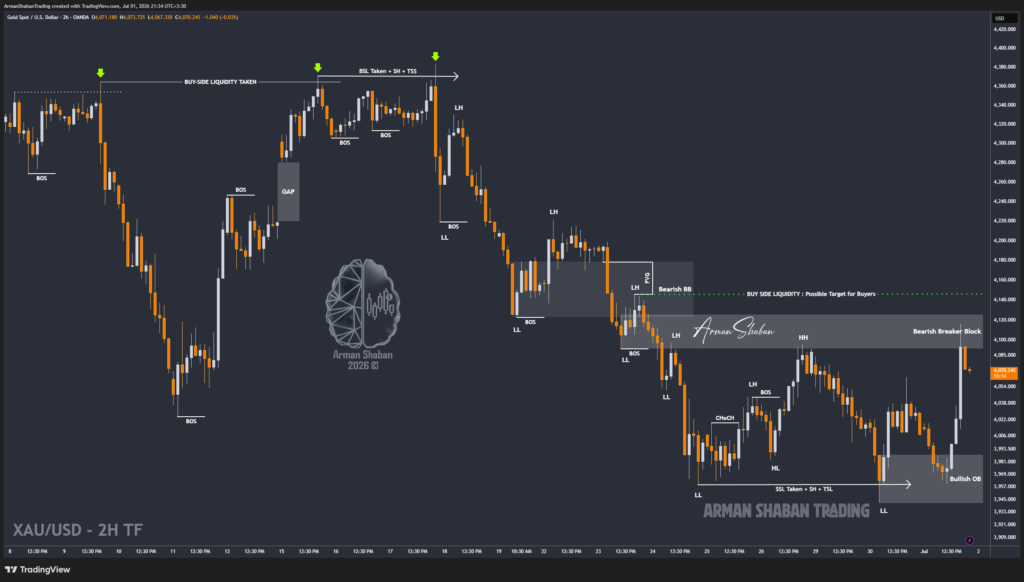
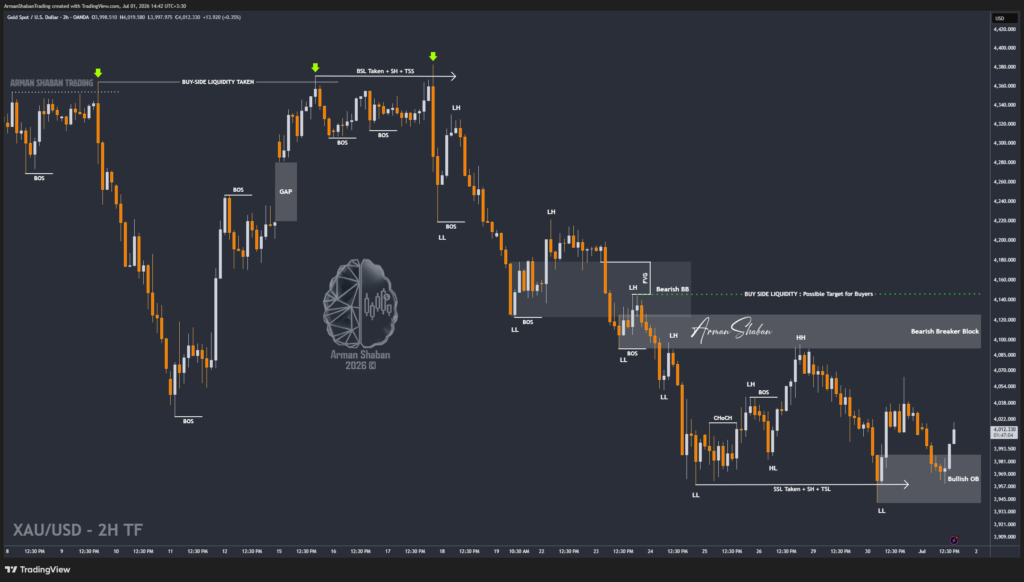
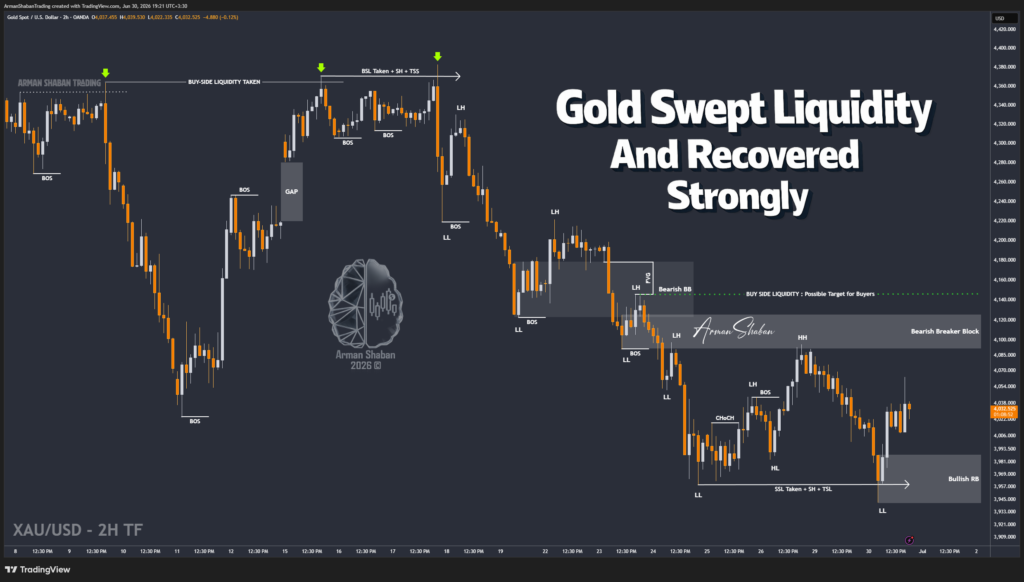
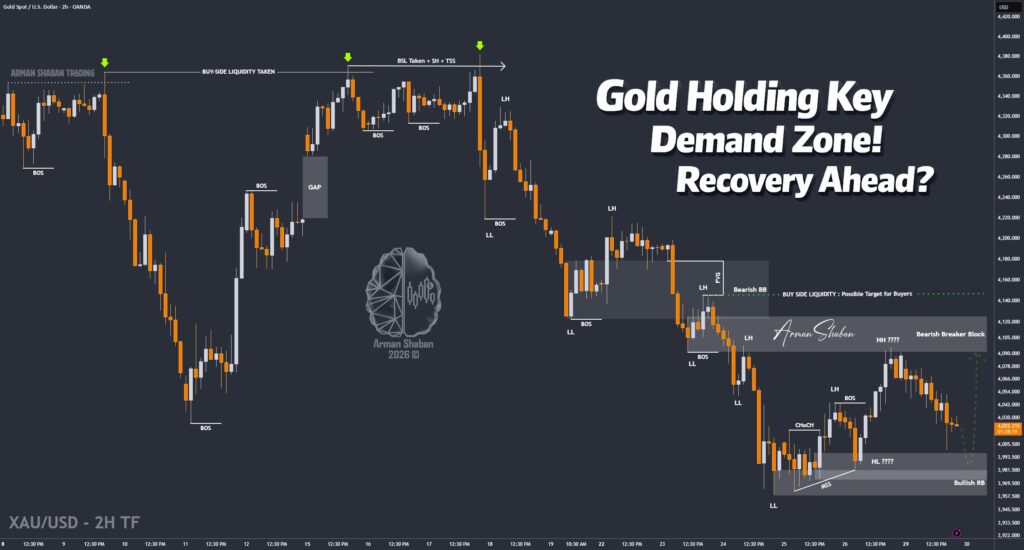
Gold Analysis: By analyzing the #Gold chart on the 2H timeframe, we can see that after the previous analysis, the initial correction we expected did happen. However, price did not stop with a simple pullback. Fresh geopolitical tensions entered the market after renewed attacks between Iran and the United States, which pushed risk sentiment sharply higher.…
Read more