Bitcoin Analysis – 3.Jul.2026
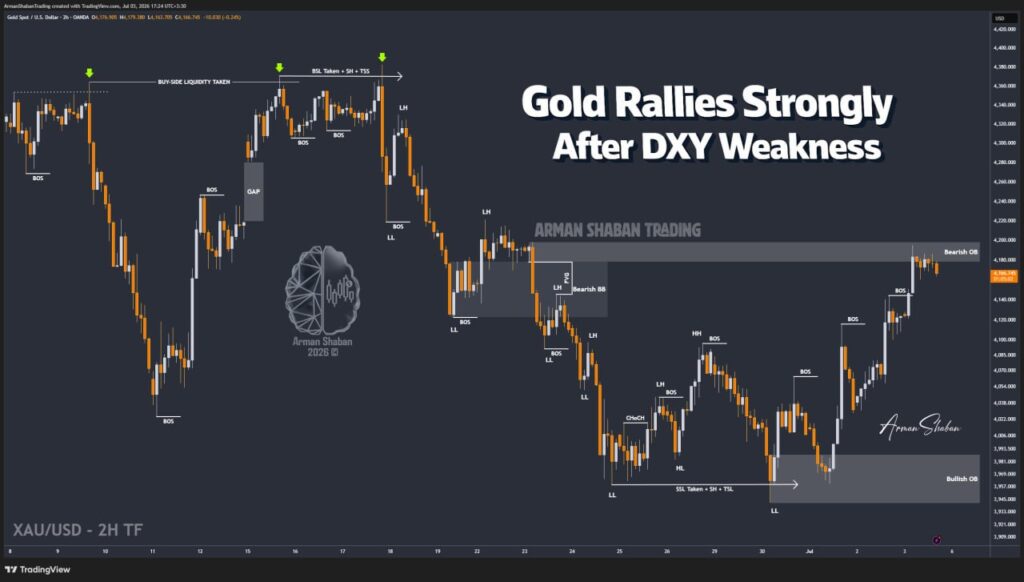
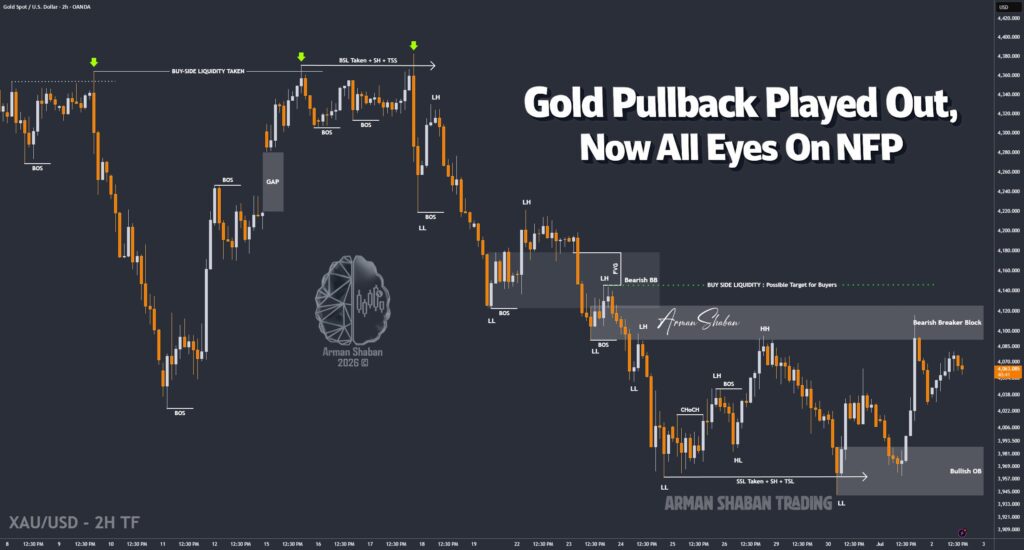
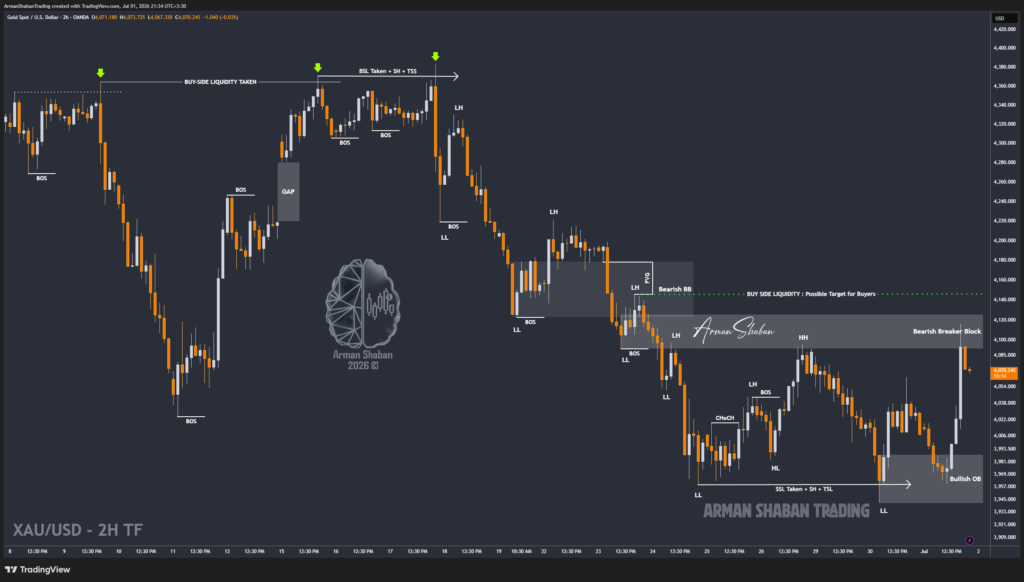
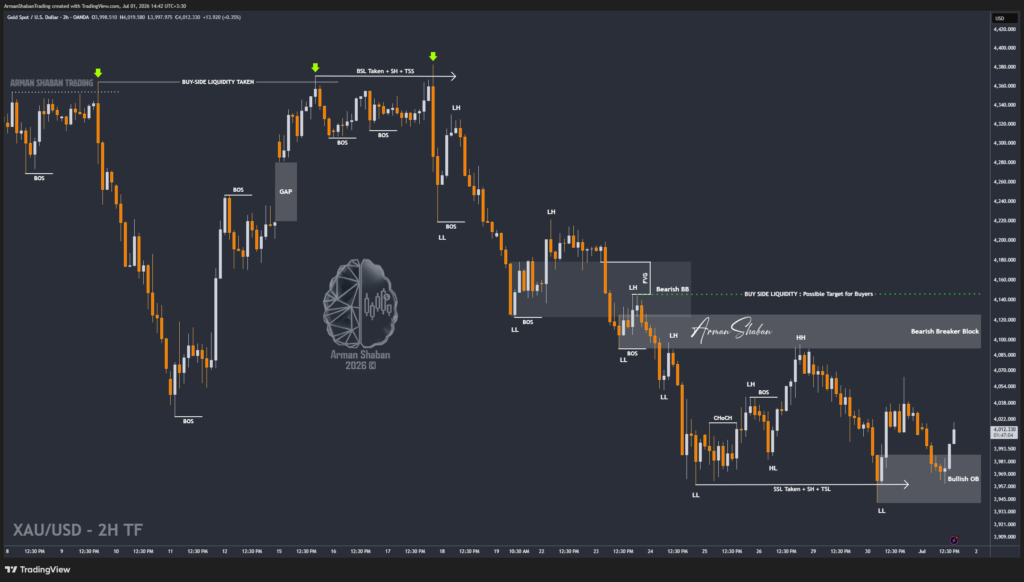
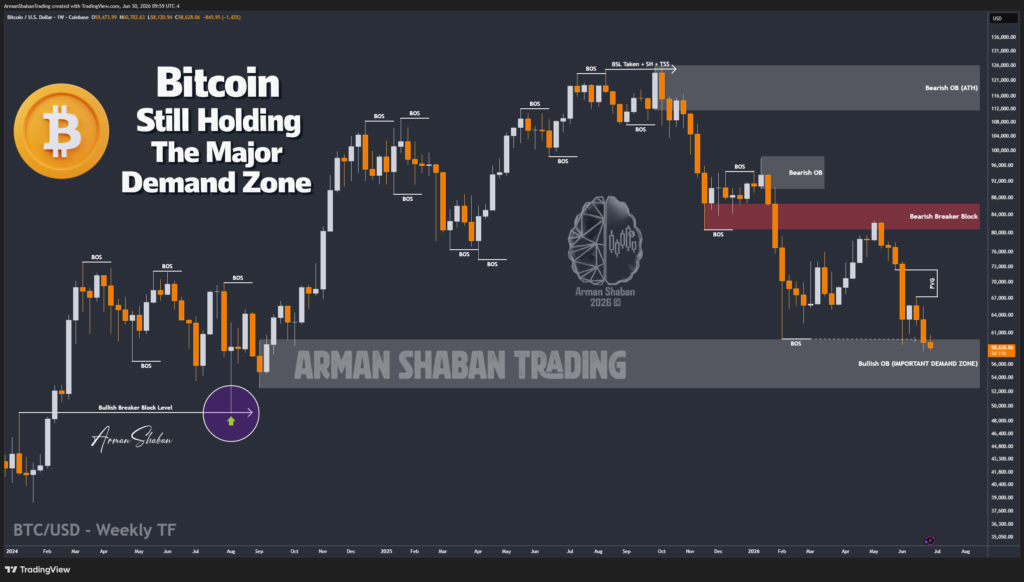
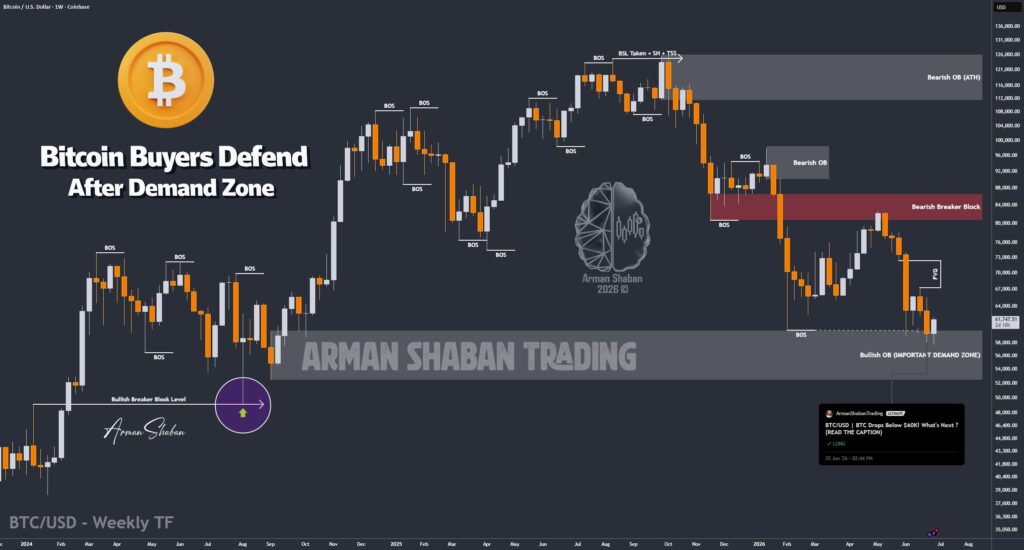
Bitcoin Analysis: By analyzing the #Bitcoin chart on the weekly timeframe, we can see that the demand zone we highlighted in the previous analysis reacted exactly as expected. Buyers stepped in from this area and pushed BTC higher, reaching around the $62,200 region. Currently, Bitcoin is trading around $61,600, and the key level to watch now…
Read more